29
/
en
AIzaSyAYiBZKx7MnpbEhh9jyipgxe19OcubqV5w
April 1, 2024
24890
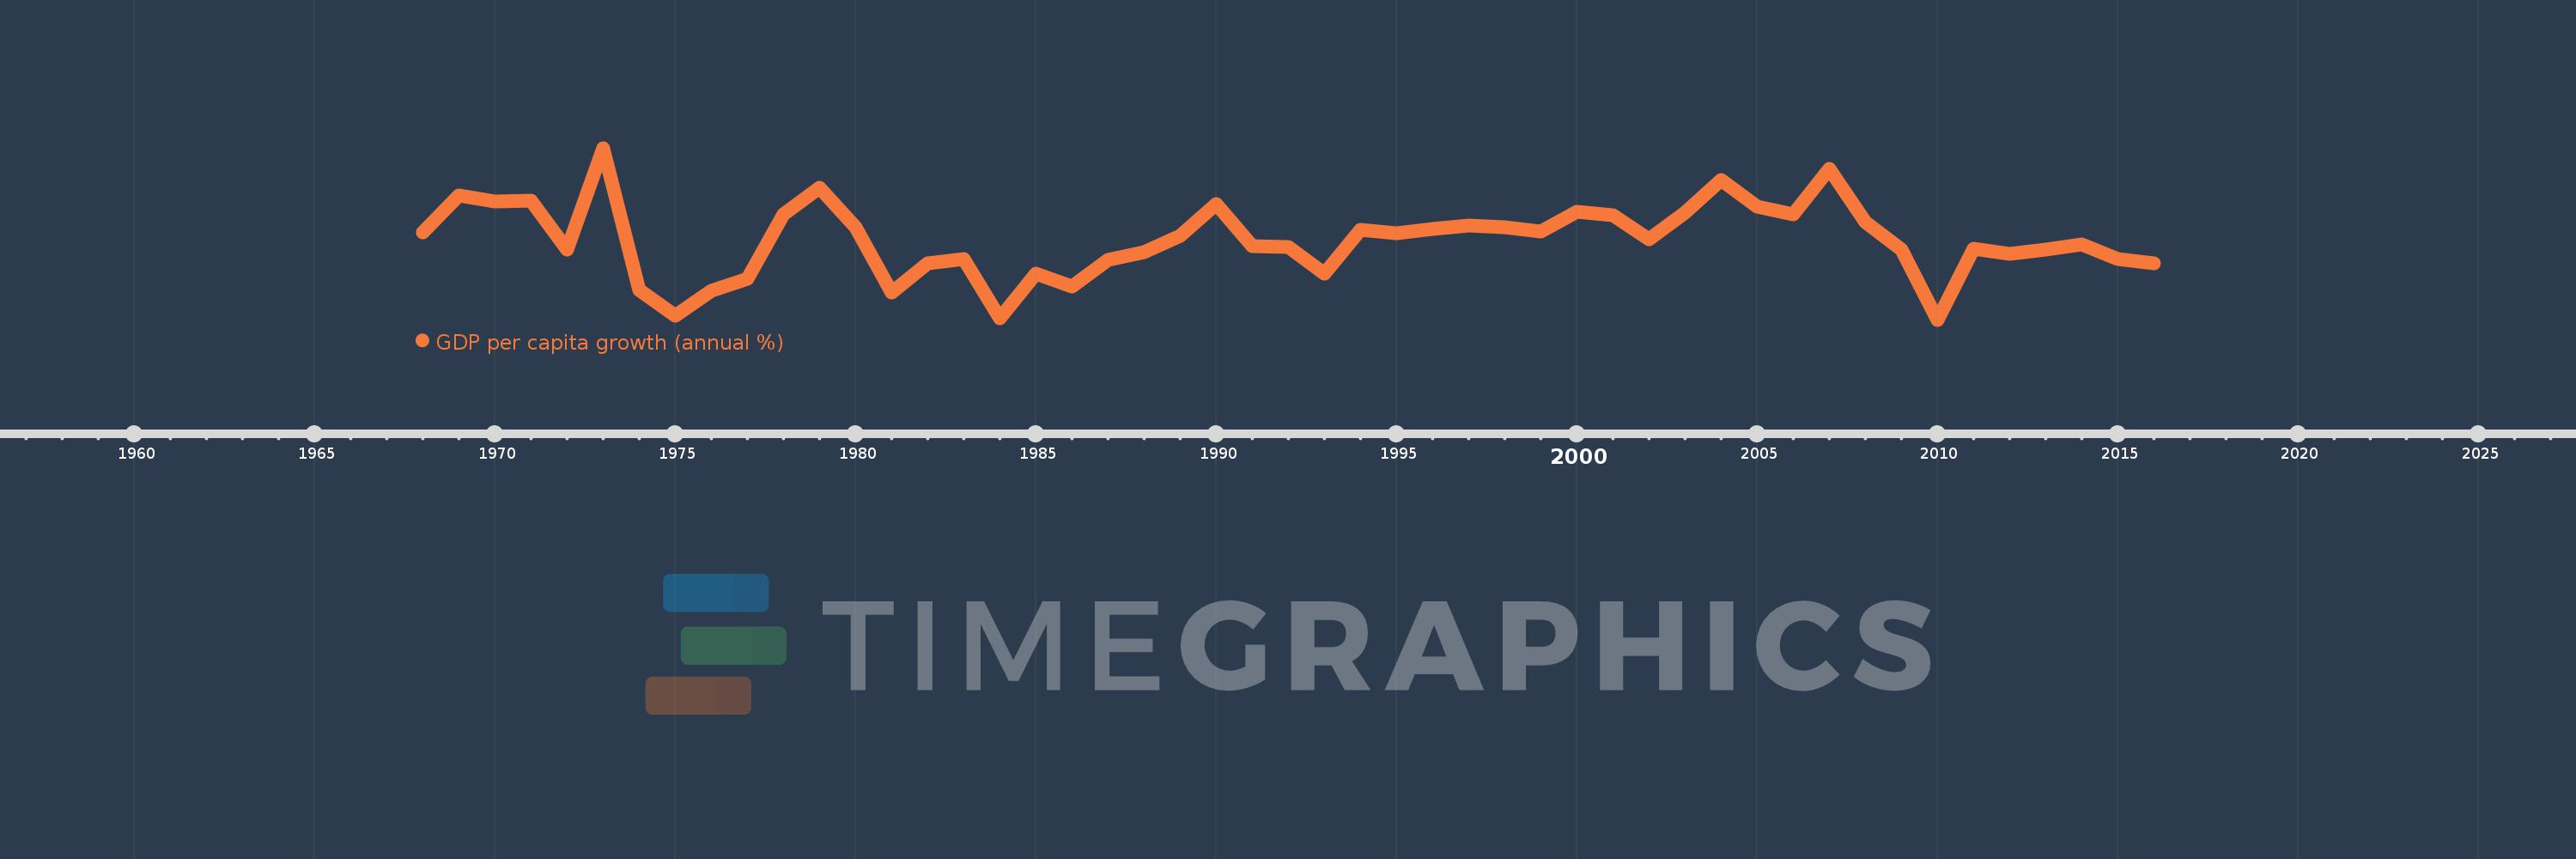
Caribbean small states
CSS
false
2
1
GDP per capita growth (annual %)
2016,2015,2014,2013,2012,2011,2010,2009,2008,2007,2006,2005,2004,2003,2002,2001,2000,1999,1998,1997,1996,1995,1994,1993,1992,1991,1990,1989,1988,1987,1986,1985,1984,1983,1982,1981,1980,1979,1978,1977,1976,1975,1974,1973,1972,1971,1970,1969,1968
This statistics in other country:
AfghanistanAlbaniaAlgeriaAndorraAngolaAntigua and BarbudaArab WorldArgentinaArmeniaArubaAustraliaAustriaAzerbaijanBahamas, TheBahrainBangladeshBarbadosBelarusBelgiumBelizeBeninBermudaBhutanBoliviaBosnia and HerzegovinaBotswanaBrazilBrunei DarussalamBulgariaBurkina FasoBurundiCabo VerdeCambodiaCameroonCanadaCaribbean small statesCayman IslandsCentral African RepublicCentral Europe and the BalticsChadChannel IslandsChileChinaColombiaComorosCongo, Dem. Rep.Congo, Rep.Costa RicaCote d'IvoireCroatiaCubaCyprusCzech RepublicDenmarkDjiboutiDominicaDominican RepublicEarly-demographic dividendEast Asia & PacificEast Asia & Pacific (excluding high income)East Asia & Pacific (IDA & IBRD countries)EcuadorEgypt, Arab Rep.El SalvadorEquatorial GuineaEritreaEstoniaEthiopiaEuro areaEurope & Central AsiaEurope & Central Asia (excluding high income)Europe & Central Asia (IDA & IBRD countries)European UnionFijiFinlandFragile and conflict affected situationsFranceFrench PolynesiaGabonGambia, TheGeorgiaGermanyGhanaGreeceGreenlandGrenadaGuatemalaGuineaGuinea-BissauGuyanaHaitiHeavily indebted poor countries (HIPC)High incomeHondurasHong Kong SAR, ChinaHungaryIBRD onlyIcelandIDA & IBRD totalIDA blendIDA onlyIDA totalIndiaIndonesiaIran, Islamic Rep.IraqIrelandIsle of ManIsraelItalyJamaicaJapanJordanKazakhstanKenyaKiribatiKorea, Rep.KosovoKuwaitKyrgyz RepublicLao PDRLate-demographic dividendLatin America & Caribbean Latin America & Caribbean (excluding high income)Latin America & the Caribbean (IDA & IBRD countries)LatviaLeast developed countries: UN classificationLebanonLesothoLiberiaLibyaLiechtensteinLithuaniaLow & middle incomeLow incomeLower middle incomeLuxembourgMacao SAR, ChinaMacedonia, FYRMadagascarMalawiMalaysiaMaldivesMaliMaltaMarshall IslandsMauritaniaMauritiusMexicoMicronesia, Fed. Sts.Middle East & North AfricaMiddle East & North Africa (excluding high income)Middle East & North Africa (IDA & IBRD countries)Middle incomeMoldovaMonacoMongoliaMontenegroMoroccoMozambiqueMyanmarNamibiaNauruNepalNetherlandsNew CaledoniaNew ZealandNicaraguaNigerNigeriaNorth AmericaNorwayOECD membersOmanOther small statesPacific island small statesPakistanPalauPanamaPapua New GuineaParaguayPeruPhilippinesPolandPortugalPost-demographic dividendPre-demographic dividendPuerto RicoQatarRomaniaRussian FederationRwandaSamoaSan MarinoSao Tome and PrincipeSaudi ArabiaSenegalSerbiaSeychellesSierra LeoneSingaporeSlovak RepublicSloveniaSmall statesSolomon IslandsSomaliaSouth AfricaSouth AsiaSouth Asia (IDA & IBRD)South SudanSpainSri LankaSt. Kitts and NevisSt. LuciaSt. Vincent and the GrenadinesSub-Saharan Africa Sub-Saharan Africa (excluding high income)Sub-Saharan Africa (IDA & IBRD countries)SudanSurinameSwazilandSwedenSwitzerlandSyrian Arab RepublicTajikistanTanzaniaThailandTimor-LesteTogoTongaTrinidad and TobagoTunisiaTurkeyTurkmenistanTuvaluUgandaUkraineUnited Arab EmiratesUnited KingdomUnited StatesUpper middle incomeUruguayUzbekistanVanuatuVenezuela, RBVietnamVirgin Islands (U.S.)West Bank and GazaWorldYemen, Rep.ZambiaZimbabwe Timeline:
This timeline shows a graph from 1968 to 2016 of Caribbean small states. No data until 1967. Number of actual observations by date: 49.
Source name:
World Development Indicators
Source organization:
World Bank national accounts data, and OECD National Accounts data files.
Categories, topics:
Economy & Growth
Last updated:
apr 23, 2017
Indicators value changes by year
Minimum:
-4.142
jan 1, 2010
At the date of observation
Value
Absolute change
Change from previous value
jan 1, 1968
1.924
+1.924
0.0%
jan 1, 1969
4.465
+2.541
132.06%
jan 1, 1970
4.044
-0.422
-9.44%
jan 1, 1971
4.115
+0.071
1.77%
jan 1, 1972
0.713
-3.402
-82.66%
jan 1, 1973
7.732
+7.019
983.97%
jan 1, 1974
-2.055
-9.788
-126.58%
jan 1, 1975
-3.847
-1.792
87.19%
jan 1, 1976
-2.154
+1.693
-44.01%
jan 1, 1977
-1.338
+0.816
-37.88%
jan 1, 1978
3.131
+4.469
-334.0%
jan 1, 1979
4.956
+1.825
58.27%
jan 1, 1980
2.278
-2.677
-54.02%
jan 1, 1981
-2.273
-4.551
-199.75%
jan 1, 1982
-0.256
+2.017
-88.75%
jan 1, 1983
0.057
+0.313
-122.31%
jan 1, 1984
-4.032
-4.089
-7.16K%
jan 1, 1985
-0.939
+3.093
-76.72%
jan 1, 1986
-1.836
-0.898
95.63%
jan 1, 1987
-0.003
+1.833
-99.84%
jan 1, 1988
0.511
+0.514
-17.95K%
jan 1, 1989
1.636
+1.125
220.09%
jan 1, 1990
3.874
+2.238
136.85%
jan 1, 1991
0.968
-2.905
-75.0%
jan 1, 1992
0.899
-0.069
-7.18%
jan 1, 1993
-0.971
-1.87
-207.99%
jan 1, 1994
2.051
+3.022
-311.26%
jan 1, 1995
1.833
-0.218
-10.64%
jan 1, 1996
2.105
+0.273
14.87%
jan 1, 1997
2.363
+0.258
12.24%
jan 1, 1998
2.251
-0.112
-4.75%
jan 1, 1999
1.953
-0.298
-13.23%
jan 1, 2000
3.301
+1.348
69.03%
jan 1, 2001
3.096
-0.205
-6.21%
jan 1, 2002
1.414
-1.682
-54.32%
jan 1, 2003
3.279
+1.865
131.86%
jan 1, 2004
5.533
+2.254
68.73%
jan 1, 2005
3.659
-1.874
-33.87%
jan 1, 2006
3.121
-0.538
-14.71%
jan 1, 2007
6.292
+3.172
101.64%
jan 1, 2008
2.601
-3.692
-58.67%
jan 1, 2009
0.722
-1.879
-72.25%
jan 1, 2010
-4.142
-4.863
-673.9%
jan 1, 2011
0.78
+4.922
-118.84%
jan 1, 2012
0.418
-0.363
-46.48%
jan 1, 2013
0.691
+0.273
65.46%
jan 1, 2014
1.078
+0.387
56.07%
jan 1, 2015
0.052
-1.026
-95.18%
jan 1, 2016
-0.271
-0.323
-621.29%
Ranking of countries by current statistics by years


Comments: