29
/
en
AIzaSyAYiBZKx7MnpbEhh9jyipgxe19OcubqV5w
April 1, 2024
118911
Denmark
DNK
true
2
1
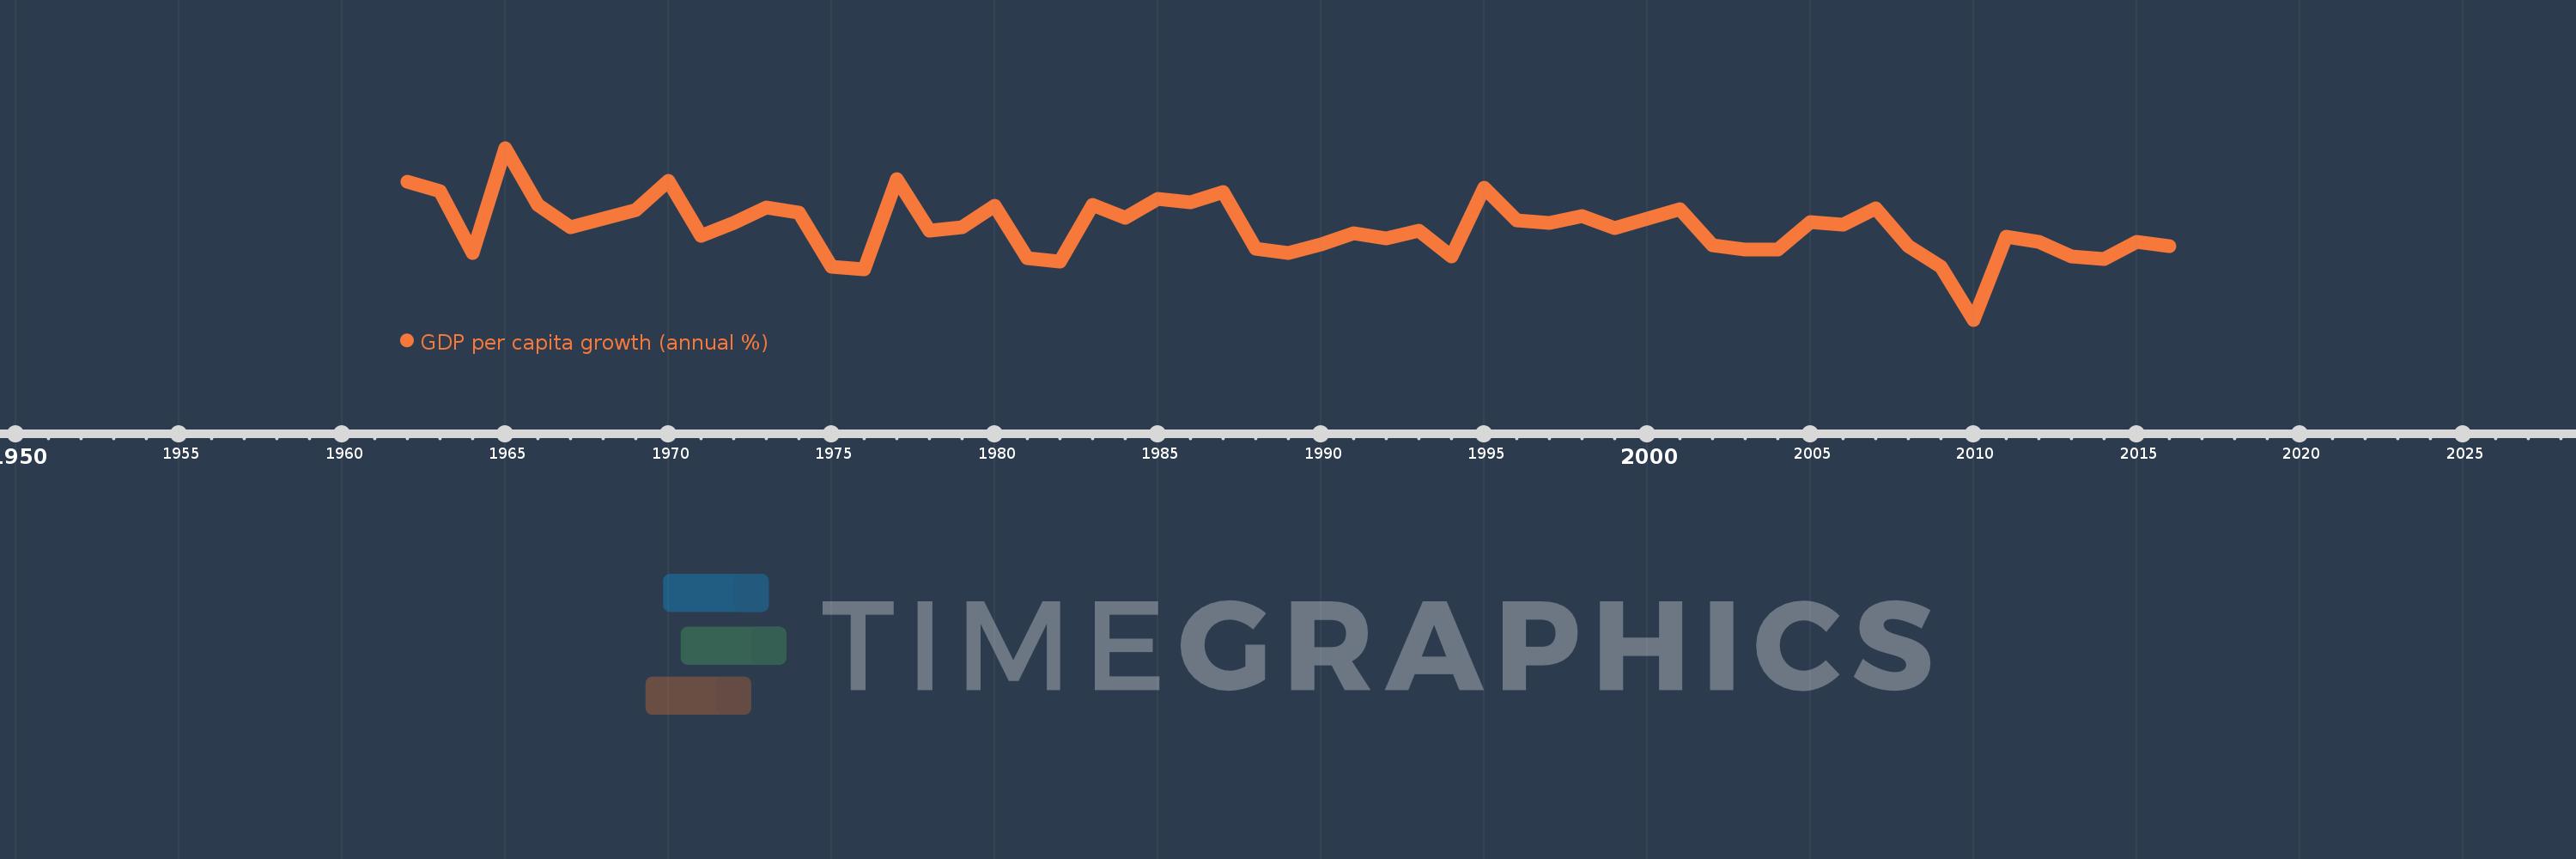
GDP per capita growth (annual %)
2016,2015,2014,2013,2012,2011,2010,2009,2008,2007,2006,2005,2004,2003,2002,2001,2000,1999,1998,1997,1996,1995,1994,1993,1992,1991,1990,1989,1988,1987,1986,1985,1984,1983,1982,1981,1980,1979,1978,1977,1976,1975,1974,1973,1972,1971,1970,1969,1968,1967,1966,1965,1964,1963,1962
This statistics in other country:
AfghanistanAlbaniaAlgeriaAndorraAngolaAntigua and BarbudaArab WorldArgentinaArmeniaArubaAustraliaAustriaAzerbaijanBahamas, TheBahrainBangladeshBarbadosBelarusBelgiumBelizeBeninBermudaBhutanBoliviaBosnia and HerzegovinaBotswanaBrazilBrunei DarussalamBulgariaBurkina FasoBurundiCabo VerdeCambodiaCameroonCanadaCaribbean small statesCayman IslandsCentral African RepublicCentral Europe and the BalticsChadChannel IslandsChileChinaColombiaComorosCongo, Dem. Rep.Congo, Rep.Costa RicaCote d'IvoireCroatiaCubaCyprusCzech RepublicDenmarkDjiboutiDominicaDominican RepublicEarly-demographic dividendEast Asia & PacificEast Asia & Pacific (excluding high income)East Asia & Pacific (IDA & IBRD countries)EcuadorEgypt, Arab Rep.El SalvadorEquatorial GuineaEritreaEstoniaEthiopiaEuro areaEurope & Central AsiaEurope & Central Asia (excluding high income)Europe & Central Asia (IDA & IBRD countries)European UnionFijiFinlandFragile and conflict affected situationsFranceFrench PolynesiaGabonGambia, TheGeorgiaGermanyGhanaGreeceGreenlandGrenadaGuatemalaGuineaGuinea-BissauGuyanaHaitiHeavily indebted poor countries (HIPC)High incomeHondurasHong Kong SAR, ChinaHungaryIBRD onlyIcelandIDA & IBRD totalIDA blendIDA onlyIDA totalIndiaIndonesiaIran, Islamic Rep.IraqIrelandIsle of ManIsraelItalyJamaicaJapanJordanKazakhstanKenyaKiribatiKorea, Rep.KosovoKuwaitKyrgyz RepublicLao PDRLate-demographic dividendLatin America & Caribbean Latin America & Caribbean (excluding high income)Latin America & the Caribbean (IDA & IBRD countries)LatviaLeast developed countries: UN classificationLebanonLesothoLiberiaLibyaLiechtensteinLithuaniaLow & middle incomeLow incomeLower middle incomeLuxembourgMacao SAR, ChinaMacedonia, FYRMadagascarMalawiMalaysiaMaldivesMaliMaltaMarshall IslandsMauritaniaMauritiusMexicoMicronesia, Fed. Sts.Middle East & North AfricaMiddle East & North Africa (excluding high income)Middle East & North Africa (IDA & IBRD countries)Middle incomeMoldovaMonacoMongoliaMontenegroMoroccoMozambiqueMyanmarNamibiaNauruNepalNetherlandsNew CaledoniaNew ZealandNicaraguaNigerNigeriaNorth AmericaNorwayOECD membersOmanOther small statesPacific island small statesPakistanPalauPanamaPapua New GuineaParaguayPeruPhilippinesPolandPortugalPost-demographic dividendPre-demographic dividendPuerto RicoQatarRomaniaRussian FederationRwandaSamoaSan MarinoSao Tome and PrincipeSaudi ArabiaSenegalSerbiaSeychellesSierra LeoneSingaporeSlovak RepublicSloveniaSmall statesSolomon IslandsSomaliaSouth AfricaSouth AsiaSouth Asia (IDA & IBRD)South SudanSpainSri LankaSt. Kitts and NevisSt. LuciaSt. Vincent and the GrenadinesSub-Saharan Africa Sub-Saharan Africa (excluding high income)Sub-Saharan Africa (IDA & IBRD countries)SudanSurinameSwazilandSwedenSwitzerlandSyrian Arab RepublicTajikistanTanzaniaThailandTimor-LesteTogoTongaTrinidad and TobagoTunisiaTurkeyTurkmenistanTuvaluUgandaUkraineUnited Arab EmiratesUnited KingdomUnited StatesUpper middle incomeUruguayUzbekistanVanuatuVenezuela, RBVietnamVirgin Islands (U.S.)West Bank and GazaWorldYemen, Rep.ZambiaZimbabwe Timeline:
This timeline shows a graph from 1962 to 2016 of Denmark. No data until 1961. Number of actual observations by date: 55.
Source name:
World Development Indicators
Source organization:
World Bank national accounts data, and OECD National Accounts data files.
Categories, topics:
Economy & Growth
Last updated:
apr 23, 2017
Indicators value changes by year
Minimum:
-5.594
jan 1, 2010
At the date of observation
Value
Absolute change
Change from previous value
jan 1, 1962
5.639
+5.639
0.0%
jan 1, 1963
4.847
-0.791
-14.03%
jan 1, 1964
-0.153
-5.0
-103.15%
jan 1, 1965
8.4
+8.553
-5.6K%
jan 1, 1966
3.744
-4.656
-55.43%
jan 1, 1967
1.919
-1.824
-48.74%
jan 1, 1968
2.609
+0.69
35.96%
jan 1, 1969
3.344
+0.734
28.15%
jan 1, 1970
5.736
+2.392
71.54%
jan 1, 1971
1.262
-4.474
-77.99%
jan 1, 1972
2.289
+1.026
81.3%
jan 1, 1973
3.581
+1.292
56.46%
jan 1, 1974
3.134
-0.447
-12.48%
jan 1, 1975
-1.277
-4.411
-140.74%
jan 1, 1976
-1.506
-0.229
17.95%
jan 1, 1977
5.827
+7.333
-486.98%
jan 1, 1978
1.662
-4.165
-71.48%
jan 1, 1979
1.957
+0.296
17.79%
jan 1, 1980
3.695
+1.738
88.78%
jan 1, 1981
-0.608
-4.304
-116.47%
jan 1, 1982
-0.859
-0.25
41.13%
jan 1, 1983
3.79
+4.649
-541.37%
jan 1, 1984
2.722
-1.068
-28.17%
jan 1, 1985
4.22
+1.498
55.02%
jan 1, 1986
3.982
-0.238
-5.64%
jan 1, 1987
4.809
+0.827
20.76%
jan 1, 1988
0.163
-4.646
-96.61%
jan 1, 1989
-0.191
-0.354
-217.3%
jan 1, 1990
0.513
+0.704
-368.12%
jan 1, 1991
1.443
+0.93
181.42%
jan 1, 1992
1.038
-0.405
-28.05%
jan 1, 1993
1.639
+0.601
57.9%
jan 1, 1994
-0.422
-2.061
-125.75%
jan 1, 1995
5.17
+5.592
-1.33K%
jan 1, 1996
2.53
-2.64
-51.07%
jan 1, 1997
2.319
-0.21
-8.31%
jan 1, 1998
2.833
+0.513
22.13%
jan 1, 1999
1.848
-0.985
-34.78%
jan 1, 2000
2.608
+0.76
41.15%
jan 1, 2001
3.401
+0.793
30.4%
jan 1, 2002
0.463
-2.938
-86.4%
jan 1, 2003
0.146
-0.317
-68.47%
jan 1, 2004
0.117
-0.028
-19.5%
jan 1, 2005
2.374
+2.257
1.92K%
jan 1, 2006
2.155
-0.219
-9.22%
jan 1, 2007
3.456
+1.301
60.36%
jan 1, 2008
0.378
-3.078
-89.05%
jan 1, 2009
-1.3
-1.678
-443.54%
jan 1, 2010
-5.594
-4.295
330.48%
jan 1, 2011
1.175
+6.769
-121.0%
jan 1, 2012
0.737
-0.438
-37.3%
jan 1, 2013
-0.449
-1.185
-160.91%
jan 1, 2014
-0.659
-0.21
46.85%
jan 1, 2015
0.75
+1.409
-213.81%
jan 1, 2016
0.409
-0.34
-45.41%
Ranking of countries by current statistics by years


Comments: