29
/
en
AIzaSyAYiBZKx7MnpbEhh9jyipgxe19OcubqV5w
April 1, 2024
285899
Zambia
ZMB
true
2
1
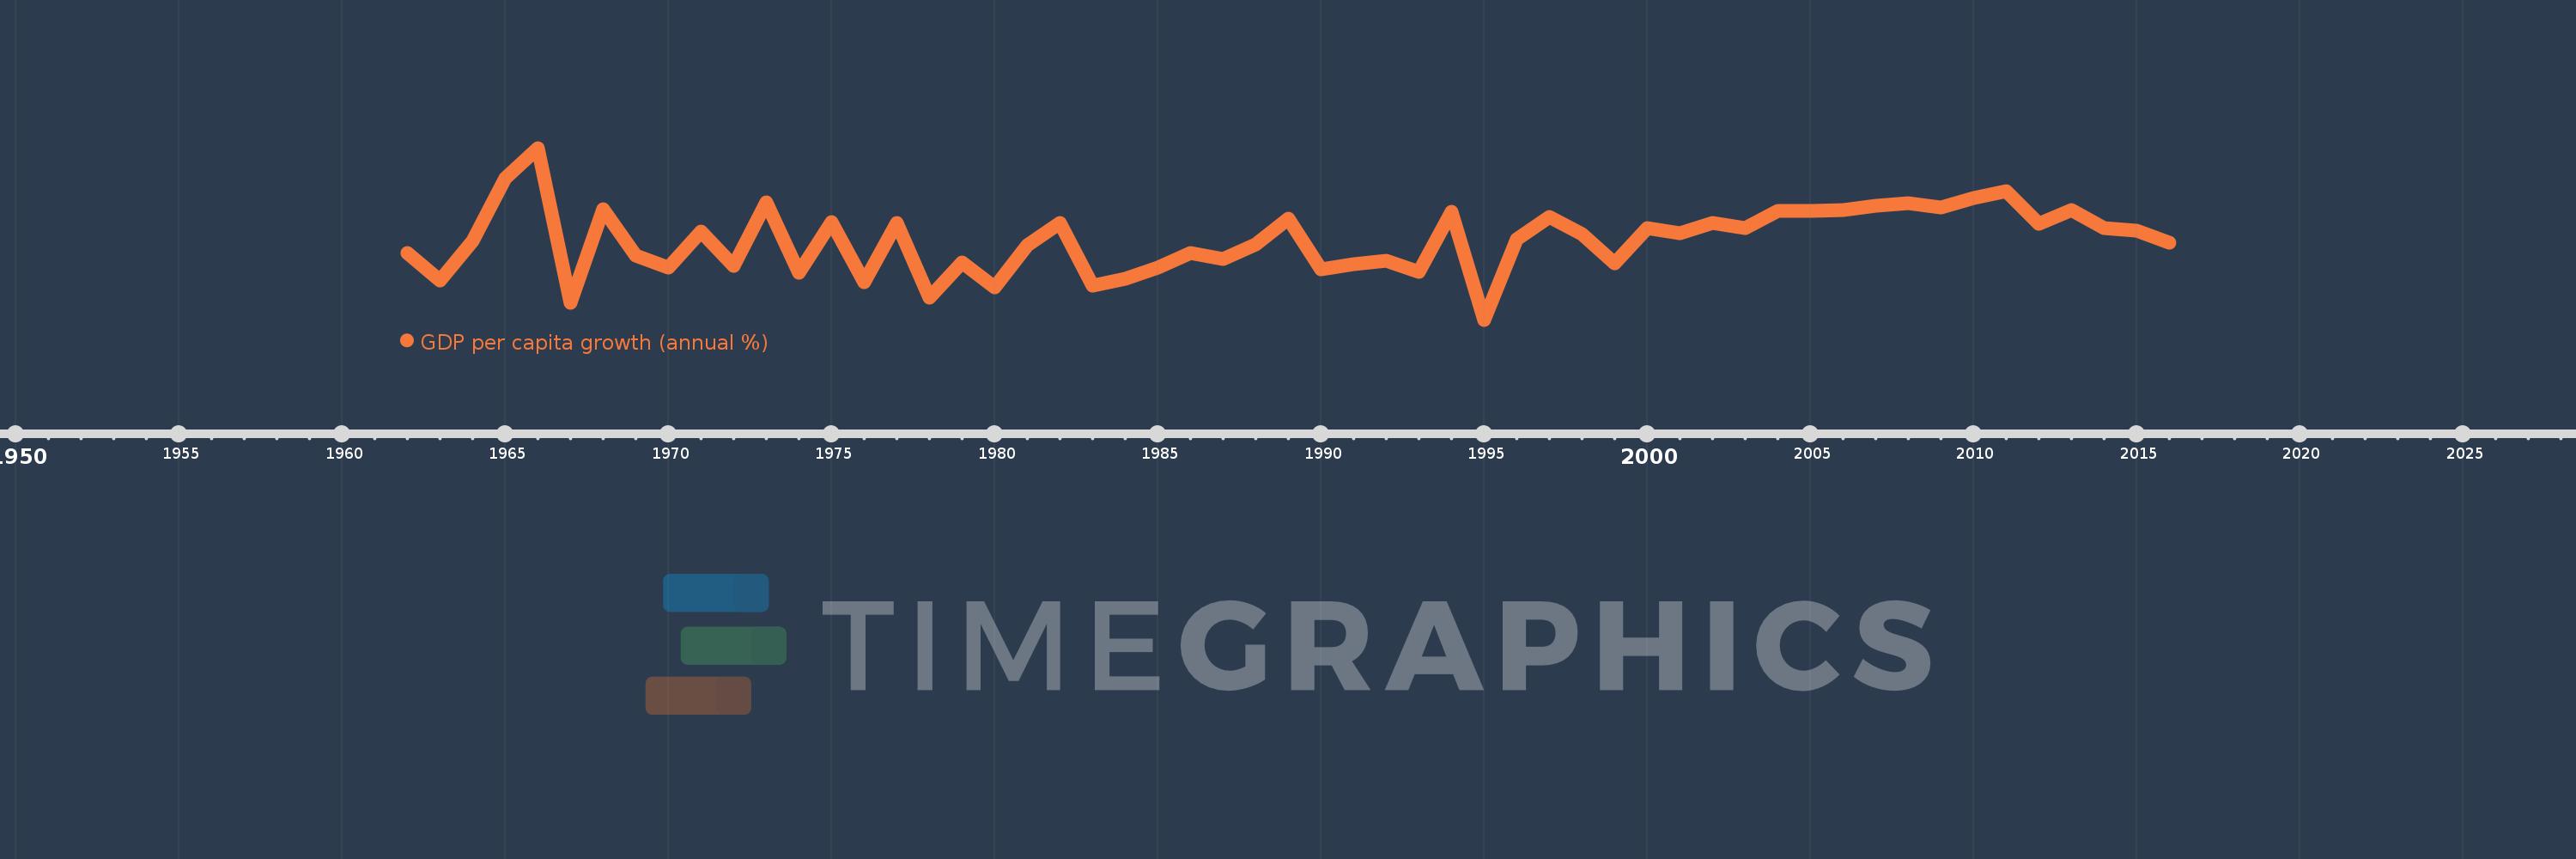
GDP per capita growth (annual %)
2016,2015,2014,2013,2012,2011,2010,2009,2008,2007,2006,2005,2004,2003,2002,2001,2000,1999,1998,1997,1996,1995,1994,1993,1992,1991,1990,1989,1988,1987,1986,1985,1984,1983,1982,1981,1980,1979,1978,1977,1976,1975,1974,1973,1972,1971,1970,1969,1968,1967,1966,1965,1964,1963,1962
This statistics in other country:
AfghanistanAlbaniaAlgeriaAndorraAngolaAntigua and BarbudaArab WorldArgentinaArmeniaArubaAustraliaAustriaAzerbaijanBahamas, TheBahrainBangladeshBarbadosBelarusBelgiumBelizeBeninBermudaBhutanBoliviaBosnia and HerzegovinaBotswanaBrazilBrunei DarussalamBulgariaBurkina FasoBurundiCabo VerdeCambodiaCameroonCanadaCaribbean small statesCayman IslandsCentral African RepublicCentral Europe and the BalticsChadChannel IslandsChileChinaColombiaComorosCongo, Dem. Rep.Congo, Rep.Costa RicaCote d'IvoireCroatiaCubaCyprusCzech RepublicDenmarkDjiboutiDominicaDominican RepublicEarly-demographic dividendEast Asia & PacificEast Asia & Pacific (excluding high income)East Asia & Pacific (IDA & IBRD countries)EcuadorEgypt, Arab Rep.El SalvadorEquatorial GuineaEritreaEstoniaEthiopiaEuro areaEurope & Central AsiaEurope & Central Asia (excluding high income)Europe & Central Asia (IDA & IBRD countries)European UnionFijiFinlandFragile and conflict affected situationsFranceFrench PolynesiaGabonGambia, TheGeorgiaGermanyGhanaGreeceGreenlandGrenadaGuatemalaGuineaGuinea-BissauGuyanaHaitiHeavily indebted poor countries (HIPC)High incomeHondurasHong Kong SAR, ChinaHungaryIBRD onlyIcelandIDA & IBRD totalIDA blendIDA onlyIDA totalIndiaIndonesiaIran, Islamic Rep.IraqIrelandIsle of ManIsraelItalyJamaicaJapanJordanKazakhstanKenyaKiribatiKorea, Rep.KosovoKuwaitKyrgyz RepublicLao PDRLate-demographic dividendLatin America & Caribbean Latin America & Caribbean (excluding high income)Latin America & the Caribbean (IDA & IBRD countries)LatviaLeast developed countries: UN classificationLebanonLesothoLiberiaLibyaLiechtensteinLithuaniaLow & middle incomeLow incomeLower middle incomeLuxembourgMacao SAR, ChinaMacedonia, FYRMadagascarMalawiMalaysiaMaldivesMaliMaltaMarshall IslandsMauritaniaMauritiusMexicoMicronesia, Fed. Sts.Middle East & North AfricaMiddle East & North Africa (excluding high income)Middle East & North Africa (IDA & IBRD countries)Middle incomeMoldovaMonacoMongoliaMontenegroMoroccoMozambiqueMyanmarNamibiaNauruNepalNetherlandsNew CaledoniaNew ZealandNicaraguaNigerNigeriaNorth AmericaNorwayOECD membersOmanOther small statesPacific island small statesPakistanPalauPanamaPapua New GuineaParaguayPeruPhilippinesPolandPortugalPost-demographic dividendPre-demographic dividendPuerto RicoQatarRomaniaRussian FederationRwandaSamoaSan MarinoSao Tome and PrincipeSaudi ArabiaSenegalSerbiaSeychellesSierra LeoneSingaporeSlovak RepublicSloveniaSmall statesSolomon IslandsSomaliaSouth AfricaSouth AsiaSouth Asia (IDA & IBRD)South SudanSpainSri LankaSt. Kitts and NevisSt. LuciaSt. Vincent and the GrenadinesSub-Saharan Africa Sub-Saharan Africa (excluding high income)Sub-Saharan Africa (IDA & IBRD countries)SudanSurinameSwazilandSwedenSwitzerlandSyrian Arab RepublicTajikistanTanzaniaThailandTimor-LesteTogoTongaTrinidad and TobagoTunisiaTurkeyTurkmenistanTuvaluUgandaUkraineUnited Arab EmiratesUnited KingdomUnited StatesUpper middle incomeUruguayUzbekistanVanuatuVenezuela, RBVietnamVirgin Islands (U.S.)West Bank and GazaWorldYemen, Rep.ZambiaZimbabwe Timeline:
This timeline shows a graph from 1962 to 2016 of Zambia. No data until 1961. Number of actual observations by date: 55.
Source name:
World Development Indicators
Source organization:
World Bank national accounts data, and OECD National Accounts data files.
Categories, topics:
Economy & Growth
Last updated:
apr 23, 2017
Indicators value changes by year
Minimum:
-10.897
jan 1, 1995
Maximum:
13.029
jan 1, 1966
At the date of observation
Value
Absolute change
Change from previous value
jan 1, 1962
-1.646
-1.646
0.0%
jan 1, 1963
-5.434
-3.788
230.05%
jan 1, 1964
0.114
+5.548
-102.1%
jan 1, 1965
8.753
+8.639
7.57K%
jan 1, 1966
13.029
+4.276
48.84%
jan 1, 1967
-8.511
-21.54
-165.32%
jan 1, 1968
4.54
+13.051
-153.35%
jan 1, 1969
-1.959
-6.499
-143.14%
jan 1, 1970
-3.648
-1.69
86.27%
jan 1, 1971
1.344
+4.993
-136.85%
jan 1, 1972
-3.446
-4.79
-356.31%
jan 1, 1973
5.479
+8.925
-259.03%
jan 1, 1974
-4.378
-9.857
-179.9%
jan 1, 1975
2.745
+7.123
-162.7%
jan 1, 1976
-5.647
-8.392
-305.7%
jan 1, 1977
2.566
+8.213
-145.45%
jan 1, 1978
-7.832
-10.399
-405.19%
jan 1, 1979
-2.878
+4.954
-63.26%
jan 1, 1980
-6.329
-3.452
119.94%
jan 1, 1981
-0.473
+5.856
-92.53%
jan 1, 1982
2.56
+3.033
-641.19%
jan 1, 1983
-6.094
-8.655
-338.02%
jan 1, 1984
-5.235
+0.859
-14.09%
jan 1, 1985
-3.594
+1.641
-31.35%
jan 1, 1986
-1.622
+1.972
-54.86%
jan 1, 1987
-2.408
-0.786
48.43%
jan 1, 1988
-0.442
+1.966
-81.66%
jan 1, 1989
3.149
+3.59
-812.91%
jan 1, 1990
-3.834
-6.983
-221.78%
jan 1, 1991
-3.196
+0.639
-16.66%
jan 1, 1992
-2.645
+0.55
-17.22%
jan 1, 1993
-4.201
-1.556
58.82%
jan 1, 1994
4.161
+8.362
-199.05%
jan 1, 1995
-10.897
-15.058
-361.87%
jan 1, 1996
0.281
+11.178
-102.58%
jan 1, 1997
3.437
+3.156
1.12K%
jan 1, 1998
1.035
-2.403
-69.9%
jan 1, 1999
-3.073
-4.107
-396.97%
jan 1, 2000
1.86
+4.932
-160.52%
jan 1, 2001
1.189
-0.671
-36.06%
jan 1, 2002
2.64
+1.451
122.04%
jan 1, 2003
1.891
-0.749
-28.38%
jan 1, 2004
4.268
+2.377
125.68%
jan 1, 2005
4.297
+0.03
0.69%
jan 1, 2006
4.405
+0.107
2.49%
jan 1, 2007
4.959
+0.554
12.58%
jan 1, 2008
5.314
+0.356
7.17%
jan 1, 2009
4.685
-0.63
-11.85%
jan 1, 2010
6.04
+1.356
28.94%
jan 1, 2011
7.052
+1.012
16.75%
jan 1, 2012
2.429
-4.623
-65.56%
jan 1, 2013
4.374
+1.945
80.08%
jan 1, 2014
1.893
-2.481
-56.72%
jan 1, 2015
1.531
-0.362
-19.13%
jan 1, 2016
-0.194
-1.724
-112.64%
Ranking of countries by current statistics by years


Comments: