29
/
en
AIzaSyAYiBZKx7MnpbEhh9jyipgxe19OcubqV5w
April 1, 2024
109671
Congo, Dem. Rep.
COD
true
2
1
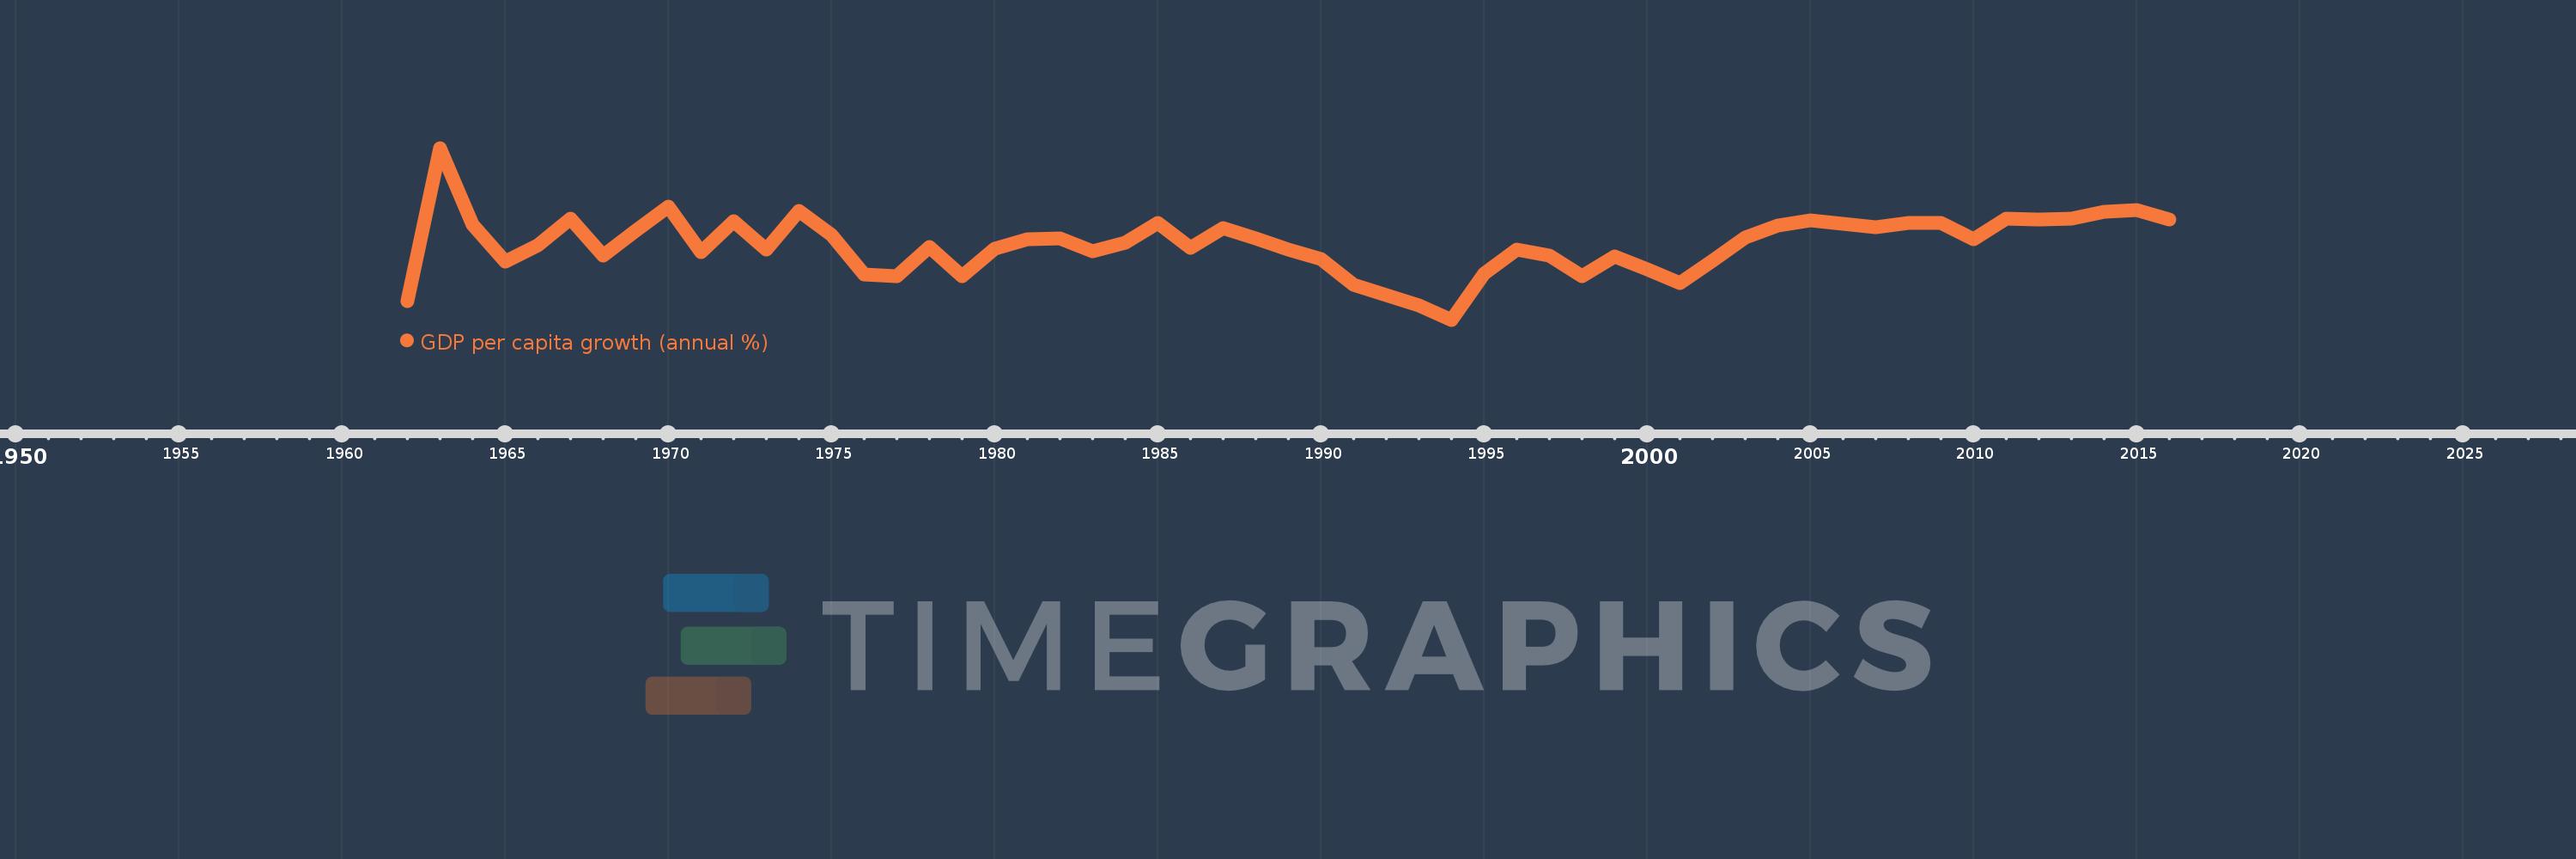
GDP per capita growth (annual %)
2016,2015,2014,2013,2012,2011,2010,2009,2008,2007,2006,2005,2004,2003,2002,2001,2000,1999,1998,1997,1996,1995,1994,1993,1992,1991,1990,1989,1988,1987,1986,1985,1984,1983,1982,1981,1980,1979,1978,1977,1976,1975,1974,1973,1972,1971,1970,1969,1968,1967,1966,1965,1964,1963,1962
This statistics in other country:
AfghanistanAlbaniaAlgeriaAndorraAngolaAntigua and BarbudaArab WorldArgentinaArmeniaArubaAustraliaAustriaAzerbaijanBahamas, TheBahrainBangladeshBarbadosBelarusBelgiumBelizeBeninBermudaBhutanBoliviaBosnia and HerzegovinaBotswanaBrazilBrunei DarussalamBulgariaBurkina FasoBurundiCabo VerdeCambodiaCameroonCanadaCaribbean small statesCayman IslandsCentral African RepublicCentral Europe and the BalticsChadChannel IslandsChileChinaColombiaComorosCongo, Dem. Rep.Congo, Rep.Costa RicaCote d'IvoireCroatiaCubaCyprusCzech RepublicDenmarkDjiboutiDominicaDominican RepublicEarly-demographic dividendEast Asia & PacificEast Asia & Pacific (excluding high income)East Asia & Pacific (IDA & IBRD countries)EcuadorEgypt, Arab Rep.El SalvadorEquatorial GuineaEritreaEstoniaEthiopiaEuro areaEurope & Central AsiaEurope & Central Asia (excluding high income)Europe & Central Asia (IDA & IBRD countries)European UnionFijiFinlandFragile and conflict affected situationsFranceFrench PolynesiaGabonGambia, TheGeorgiaGermanyGhanaGreeceGreenlandGrenadaGuatemalaGuineaGuinea-BissauGuyanaHaitiHeavily indebted poor countries (HIPC)High incomeHondurasHong Kong SAR, ChinaHungaryIBRD onlyIcelandIDA & IBRD totalIDA blendIDA onlyIDA totalIndiaIndonesiaIran, Islamic Rep.IraqIrelandIsle of ManIsraelItalyJamaicaJapanJordanKazakhstanKenyaKiribatiKorea, Rep.KosovoKuwaitKyrgyz RepublicLao PDRLate-demographic dividendLatin America & Caribbean Latin America & Caribbean (excluding high income)Latin America & the Caribbean (IDA & IBRD countries)LatviaLeast developed countries: UN classificationLebanonLesothoLiberiaLibyaLiechtensteinLithuaniaLow & middle incomeLow incomeLower middle incomeLuxembourgMacao SAR, ChinaMacedonia, FYRMadagascarMalawiMalaysiaMaldivesMaliMaltaMarshall IslandsMauritaniaMauritiusMexicoMicronesia, Fed. Sts.Middle East & North AfricaMiddle East & North Africa (excluding high income)Middle East & North Africa (IDA & IBRD countries)Middle incomeMoldovaMonacoMongoliaMontenegroMoroccoMozambiqueMyanmarNamibiaNauruNepalNetherlandsNew CaledoniaNew ZealandNicaraguaNigerNigeriaNorth AmericaNorwayOECD membersOmanOther small statesPacific island small statesPakistanPalauPanamaPapua New GuineaParaguayPeruPhilippinesPolandPortugalPost-demographic dividendPre-demographic dividendPuerto RicoQatarRomaniaRussian FederationRwandaSamoaSan MarinoSao Tome and PrincipeSaudi ArabiaSenegalSerbiaSeychellesSierra LeoneSingaporeSlovak RepublicSloveniaSmall statesSolomon IslandsSomaliaSouth AfricaSouth AsiaSouth Asia (IDA & IBRD)South SudanSpainSri LankaSt. Kitts and NevisSt. LuciaSt. Vincent and the GrenadinesSub-Saharan Africa Sub-Saharan Africa (excluding high income)Sub-Saharan Africa (IDA & IBRD countries)SudanSurinameSwazilandSwedenSwitzerlandSyrian Arab RepublicTajikistanTanzaniaThailandTimor-LesteTogoTongaTrinidad and TobagoTunisiaTurkeyTurkmenistanTuvaluUgandaUkraineUnited Arab EmiratesUnited KingdomUnited StatesUpper middle incomeUruguayUzbekistanVanuatuVenezuela, RBVietnamVirgin Islands (U.S.)West Bank and GazaWorldYemen, Rep.ZambiaZimbabwe Timeline:
This timeline shows a graph from 1962 to 2016 of Congo, Dem. Rep.. No data until 1961. Number of actual observations by date: 55.
Source name:
World Development Indicators
Source organization:
World Bank national accounts data, and OECD National Accounts data files.
Categories, topics:
Economy & Growth
Last updated:
apr 23, 2017
Indicators value changes by year
Minimum:
-16.839
jan 1, 1994
Maximum:
18.152
jan 1, 1963
At the date of observation
Value
Absolute change
Change from previous value
jan 1, 1962
-13.072
-13.072
0.0%
jan 1, 1963
18.152
+31.223
-238.86%
jan 1, 1964
2.525
-15.626
-86.09%
jan 1, 1965
-4.991
-7.516
-297.64%
jan 1, 1966
-1.712
+3.279
-65.7%
jan 1, 1967
3.834
+5.546
-323.97%
jan 1, 1968
-3.768
-7.602
-198.26%
jan 1, 1969
1.381
+5.149
-136.67%
jan 1, 1970
6.263
+4.881
353.34%
jan 1, 1971
-2.992
-9.255
-147.78%
jan 1, 1972
3.153
+6.145
-205.38%
jan 1, 1973
-2.494
-5.647
-179.1%
jan 1, 1974
5.298
+7.792
-312.39%
jan 1, 1975
0.393
-4.905
-92.58%
jan 1, 1976
-7.555
-7.948
-2.02K%
jan 1, 1977
-7.94
-0.385
5.1%
jan 1, 1978
-2.09
+5.85
-73.68%
jan 1, 1979
-8.022
-5.932
283.85%
jan 1, 1980
-2.343
+5.679
-70.8%
jan 1, 1981
-0.523
+1.82
-77.69%
jan 1, 1982
-0.267
+0.256
-48.94%
jan 1, 1983
-2.941
-2.674
1.0K%
jan 1, 1984
-1.109
+1.832
-62.3%
jan 1, 1985
2.856
+3.965
-357.63%
jan 1, 1986
-2.196
-5.052
-176.87%
jan 1, 1987
1.852
+4.048
-184.36%
jan 1, 1988
-0.213
-2.065
-111.5%
jan 1, 1989
-2.502
-2.289
1.07K%
jan 1, 1990
-4.408
-1.906
76.15%
jan 1, 1991
-9.774
-5.366
121.75%
jan 1, 1992
-11.817
-2.043
20.9%
jan 1, 1993
-13.993
-2.176
18.41%
jan 1, 1994
-16.839
-2.846
20.34%
jan 1, 1995
-7.407
+9.432
-56.01%
jan 1, 1996
-2.593
+4.814
-64.99%
jan 1, 1997
-3.853
-1.259
48.55%
jan 1, 1998
-8.018
-4.165
108.11%
jan 1, 1999
-3.972
+4.045
-50.46%
jan 1, 2000
-6.603
-2.631
66.23%
jan 1, 2001
-9.353
-2.75
41.64%
jan 1, 2002
-4.873
+4.48
-47.9%
jan 1, 2003
-0.127
+4.746
-97.39%
jan 1, 2004
2.305
+2.432
-1.91K%
jan 1, 2005
3.373
+1.068
46.34%
jan 1, 2006
2.777
-0.596
-17.66%
jan 1, 2007
1.98
-0.797
-28.68%
jan 1, 2008
2.871
+0.891
44.97%
jan 1, 2009
2.833
-0.038
-1.34%
jan 1, 2010
-0.425
-3.257
-114.99%
jan 1, 2011
3.679
+4.104
-966.34%
jan 1, 2012
3.492
-0.187
-5.08%
jan 1, 2013
3.798
+0.306
8.76%
jan 1, 2014
5.121
+1.323
34.83%
jan 1, 2015
5.587
+0.466
9.1%
jan 1, 2016
3.609
-1.978
-35.4%
Ranking of countries by current statistics by years


Comments: