29
/
en
AIzaSyAYiBZKx7MnpbEhh9jyipgxe19OcubqV5w
April 1, 2024
142546
Greenland
GRL
true
2
1
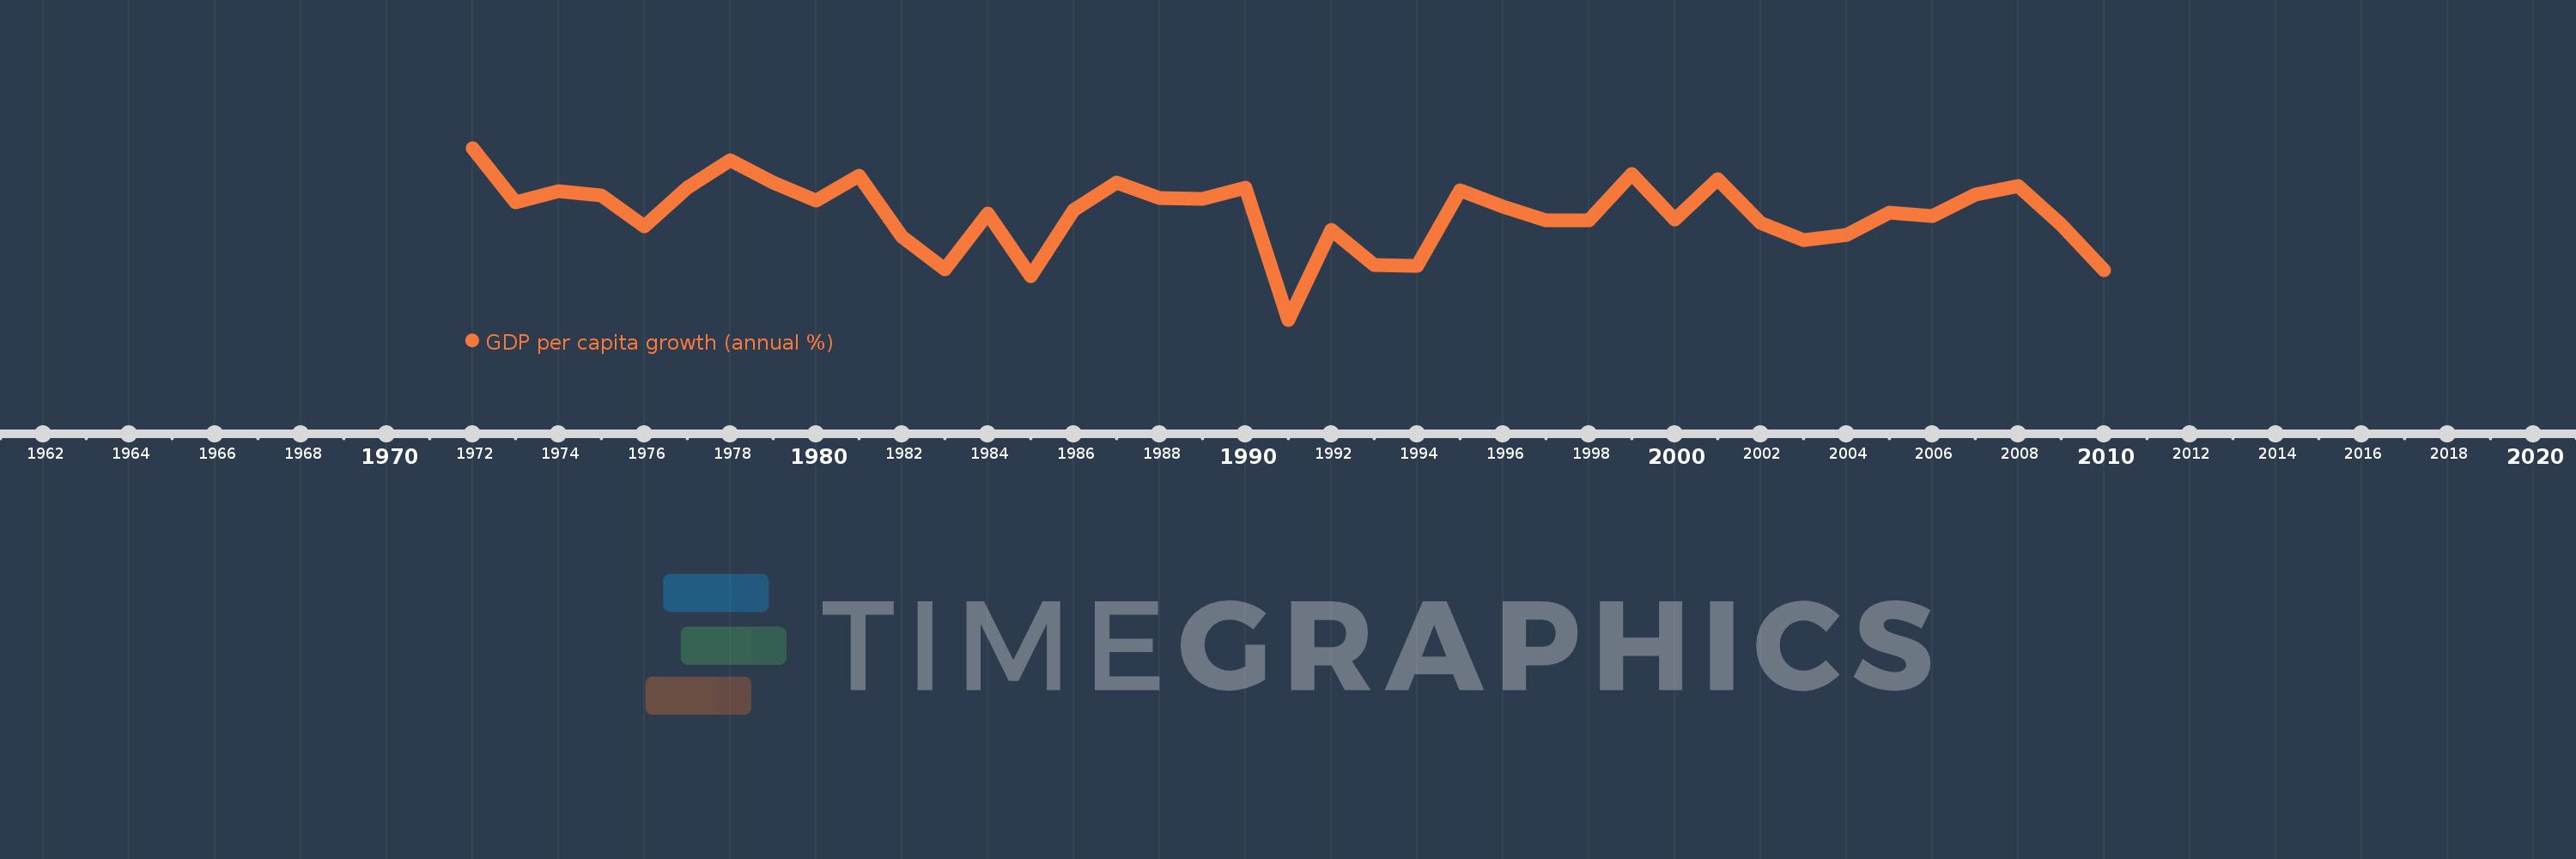
GDP per capita growth (annual %)
2010,2009,2008,2007,2006,2005,2004,2003,2002,2001,2000,1999,1998,1997,1996,1995,1994,1993,1992,1991,1990,1989,1988,1987,1986,1985,1984,1983,1982,1981,1980,1979,1978,1977,1976,1975,1974,1973,1972
This statistics in other country:
AfghanistanAlbaniaAlgeriaAndorraAngolaAntigua and BarbudaArab WorldArgentinaArmeniaArubaAustraliaAustriaAzerbaijanBahamas, TheBahrainBangladeshBarbadosBelarusBelgiumBelizeBeninBermudaBhutanBoliviaBosnia and HerzegovinaBotswanaBrazilBrunei DarussalamBulgariaBurkina FasoBurundiCabo VerdeCambodiaCameroonCanadaCaribbean small statesCayman IslandsCentral African RepublicCentral Europe and the BalticsChadChannel IslandsChileChinaColombiaComorosCongo, Dem. Rep.Congo, Rep.Costa RicaCote d'IvoireCroatiaCubaCyprusCzech RepublicDenmarkDjiboutiDominicaDominican RepublicEarly-demographic dividendEast Asia & PacificEast Asia & Pacific (excluding high income)East Asia & Pacific (IDA & IBRD countries)EcuadorEgypt, Arab Rep.El SalvadorEquatorial GuineaEritreaEstoniaEthiopiaEuro areaEurope & Central AsiaEurope & Central Asia (excluding high income)Europe & Central Asia (IDA & IBRD countries)European UnionFijiFinlandFragile and conflict affected situationsFranceFrench PolynesiaGabonGambia, TheGeorgiaGermanyGhanaGreeceGreenlandGrenadaGuatemalaGuineaGuinea-BissauGuyanaHaitiHeavily indebted poor countries (HIPC)High incomeHondurasHong Kong SAR, ChinaHungaryIBRD onlyIcelandIDA & IBRD totalIDA blendIDA onlyIDA totalIndiaIndonesiaIran, Islamic Rep.IraqIrelandIsle of ManIsraelItalyJamaicaJapanJordanKazakhstanKenyaKiribatiKorea, Rep.KosovoKuwaitKyrgyz RepublicLao PDRLate-demographic dividendLatin America & Caribbean Latin America & Caribbean (excluding high income)Latin America & the Caribbean (IDA & IBRD countries)LatviaLeast developed countries: UN classificationLebanonLesothoLiberiaLibyaLiechtensteinLithuaniaLow & middle incomeLow incomeLower middle incomeLuxembourgMacao SAR, ChinaMacedonia, FYRMadagascarMalawiMalaysiaMaldivesMaliMaltaMarshall IslandsMauritaniaMauritiusMexicoMicronesia, Fed. Sts.Middle East & North AfricaMiddle East & North Africa (excluding high income)Middle East & North Africa (IDA & IBRD countries)Middle incomeMoldovaMonacoMongoliaMontenegroMoroccoMozambiqueMyanmarNamibiaNauruNepalNetherlandsNew CaledoniaNew ZealandNicaraguaNigerNigeriaNorth AmericaNorwayOECD membersOmanOther small statesPacific island small statesPakistanPalauPanamaPapua New GuineaParaguayPeruPhilippinesPolandPortugalPost-demographic dividendPre-demographic dividendPuerto RicoQatarRomaniaRussian FederationRwandaSamoaSan MarinoSao Tome and PrincipeSaudi ArabiaSenegalSerbiaSeychellesSierra LeoneSingaporeSlovak RepublicSloveniaSmall statesSolomon IslandsSomaliaSouth AfricaSouth AsiaSouth Asia (IDA & IBRD)South SudanSpainSri LankaSt. Kitts and NevisSt. LuciaSt. Vincent and the GrenadinesSub-Saharan Africa Sub-Saharan Africa (excluding high income)Sub-Saharan Africa (IDA & IBRD countries)SudanSurinameSwazilandSwedenSwitzerlandSyrian Arab RepublicTajikistanTanzaniaThailandTimor-LesteTogoTongaTrinidad and TobagoTunisiaTurkeyTurkmenistanTuvaluUgandaUkraineUnited Arab EmiratesUnited KingdomUnited StatesUpper middle incomeUruguayUzbekistanVanuatuVenezuela, RBVietnamVirgin Islands (U.S.)West Bank and GazaWorldYemen, Rep.ZambiaZimbabwe Timeline:
This timeline shows a graph from 1972 to 2010 of Greenland. No data until 1971. Number of actual observations by date: 39.
Source name:
World Development Indicators
Source organization:
World Bank national accounts data, and OECD National Accounts data files.
Categories, topics:
Economy & Growth
Last updated:
apr 23, 2017
Indicators value changes by year
Minimum:
-12.196
jan 1, 1991
Maximum:
11.145
jan 1, 1972
At the date of observation
Value
Absolute change
Change from previous value
jan 1, 1972
11.145
+11.145
0.0%
jan 1, 1973
3.759
-7.385
-66.27%
jan 1, 1974
5.28
+1.521
40.46%
jan 1, 1975
4.639
-0.642
-12.15%
jan 1, 1976
0.443
-4.195
-90.44%
jan 1, 1977
5.746
+5.303
1.2K%
jan 1, 1978
9.483
+3.737
65.04%
jan 1, 1979
6.448
-3.035
-32.01%
jan 1, 1980
4.015
-2.433
-37.73%
jan 1, 1981
7.377
+3.362
83.74%
jan 1, 1982
-0.914
-8.291
-112.39%
jan 1, 1983
-5.348
-4.434
485.22%
jan 1, 1984
2.266
+7.613
-142.37%
jan 1, 1985
-6.259
-8.525
-376.25%
jan 1, 1986
2.682
+8.941
-142.85%
jan 1, 1987
6.497
+3.815
142.22%
jan 1, 1988
4.346
-2.151
-33.11%
jan 1, 1989
4.255
-0.091
-2.09%
jan 1, 1990
5.695
+1.441
33.86%
jan 1, 1991
-12.196
-17.891
-314.14%
jan 1, 1992
0.067
+12.262
-100.55%
jan 1, 1993
-4.769
-4.835
-7.27K%
jan 1, 1994
-4.856
-0.087
1.83%
jan 1, 1995
5.352
+10.208
-210.21%
jan 1, 1996
3.171
-2.181
-40.75%
jan 1, 1997
1.348
-1.823
-57.49%
jan 1, 1998
1.288
-0.06
-4.47%
jan 1, 1999
7.566
+6.278
487.54%
jan 1, 2000
1.378
-6.188
-81.79%
jan 1, 2001
6.911
+5.533
401.57%
jan 1, 2002
0.999
-5.912
-85.54%
jan 1, 2003
-1.424
-2.424
-242.5%
jan 1, 2004
-0.653
+0.771
-54.12%
jan 1, 2005
2.404
+3.058
-467.94%
jan 1, 2006
1.937
-0.468
-19.45%
jan 1, 2007
4.765
+2.829
146.06%
jan 1, 2008
5.922
+1.156
24.27%
jan 1, 2009
0.75
-5.171
-87.33%
jan 1, 2010
-5.404
-6.154
-820.19%
Ranking of countries by current statistics by years


Comments: