29
/
en
AIzaSyAYiBZKx7MnpbEhh9jyipgxe19OcubqV5w
April 1, 2024
174114
Lao PDR
LAO
true
2
1
GDP per capita growth (annual %)
2016,2015,2014,2013,2012,2011,2010,2009,2008,2007,2006,2005,2004,2003,2002,2001,2000,1999,1998,1997,1996,1995,1994,1993,1992,1991,1990,1989,1988,1987,1986
This statistics in other country:
AfghanistanAlbaniaAlgeriaAndorraAngolaAntigua and BarbudaArab WorldArgentinaArmeniaArubaAustraliaAustriaAzerbaijanBahamas, TheBahrainBangladeshBarbadosBelarusBelgiumBelizeBeninBermudaBhutanBoliviaBosnia and HerzegovinaBotswanaBrazilBrunei DarussalamBulgariaBurkina FasoBurundiCabo VerdeCambodiaCameroonCanadaCaribbean small statesCayman IslandsCentral African RepublicCentral Europe and the BalticsChadChannel IslandsChileChinaColombiaComorosCongo, Dem. Rep.Congo, Rep.Costa RicaCote d'IvoireCroatiaCubaCyprusCzech RepublicDenmarkDjiboutiDominicaDominican RepublicEarly-demographic dividendEast Asia & PacificEast Asia & Pacific (excluding high income)East Asia & Pacific (IDA & IBRD countries)EcuadorEgypt, Arab Rep.El SalvadorEquatorial GuineaEritreaEstoniaEthiopiaEuro areaEurope & Central AsiaEurope & Central Asia (excluding high income)Europe & Central Asia (IDA & IBRD countries)European UnionFijiFinlandFragile and conflict affected situationsFranceFrench PolynesiaGabonGambia, TheGeorgiaGermanyGhanaGreeceGreenlandGrenadaGuatemalaGuineaGuinea-BissauGuyanaHaitiHeavily indebted poor countries (HIPC)High incomeHondurasHong Kong SAR, ChinaHungaryIBRD onlyIcelandIDA & IBRD totalIDA blendIDA onlyIDA totalIndiaIndonesiaIran, Islamic Rep.IraqIrelandIsle of ManIsraelItalyJamaicaJapanJordanKazakhstanKenyaKiribatiKorea, Rep.KosovoKuwaitKyrgyz RepublicLao PDRLate-demographic dividendLatin America & Caribbean Latin America & Caribbean (excluding high income)Latin America & the Caribbean (IDA & IBRD countries)LatviaLeast developed countries: UN classificationLebanonLesothoLiberiaLibyaLiechtensteinLithuaniaLow & middle incomeLow incomeLower middle incomeLuxembourgMacao SAR, ChinaMacedonia, FYRMadagascarMalawiMalaysiaMaldivesMaliMaltaMarshall IslandsMauritaniaMauritiusMexicoMicronesia, Fed. Sts.Middle East & North AfricaMiddle East & North Africa (excluding high income)Middle East & North Africa (IDA & IBRD countries)Middle incomeMoldovaMonacoMongoliaMontenegroMoroccoMozambiqueMyanmarNamibiaNauruNepalNetherlandsNew CaledoniaNew ZealandNicaraguaNigerNigeriaNorth AmericaNorwayOECD membersOmanOther small statesPacific island small statesPakistanPalauPanamaPapua New GuineaParaguayPeruPhilippinesPolandPortugalPost-demographic dividendPre-demographic dividendPuerto RicoQatarRomaniaRussian FederationRwandaSamoaSan MarinoSao Tome and PrincipeSaudi ArabiaSenegalSerbiaSeychellesSierra LeoneSingaporeSlovak RepublicSloveniaSmall statesSolomon IslandsSomaliaSouth AfricaSouth AsiaSouth Asia (IDA & IBRD)South SudanSpainSri LankaSt. Kitts and NevisSt. LuciaSt. Vincent and the GrenadinesSub-Saharan Africa Sub-Saharan Africa (excluding high income)Sub-Saharan Africa (IDA & IBRD countries)SudanSurinameSwazilandSwedenSwitzerlandSyrian Arab RepublicTajikistanTanzaniaThailandTimor-LesteTogoTongaTrinidad and TobagoTunisiaTurkeyTurkmenistanTuvaluUgandaUkraineUnited Arab EmiratesUnited KingdomUnited StatesUpper middle incomeUruguayUzbekistanVanuatuVenezuela, RBVietnamVirgin Islands (U.S.)West Bank and GazaWorldYemen, Rep.ZambiaZimbabwe Timeline:
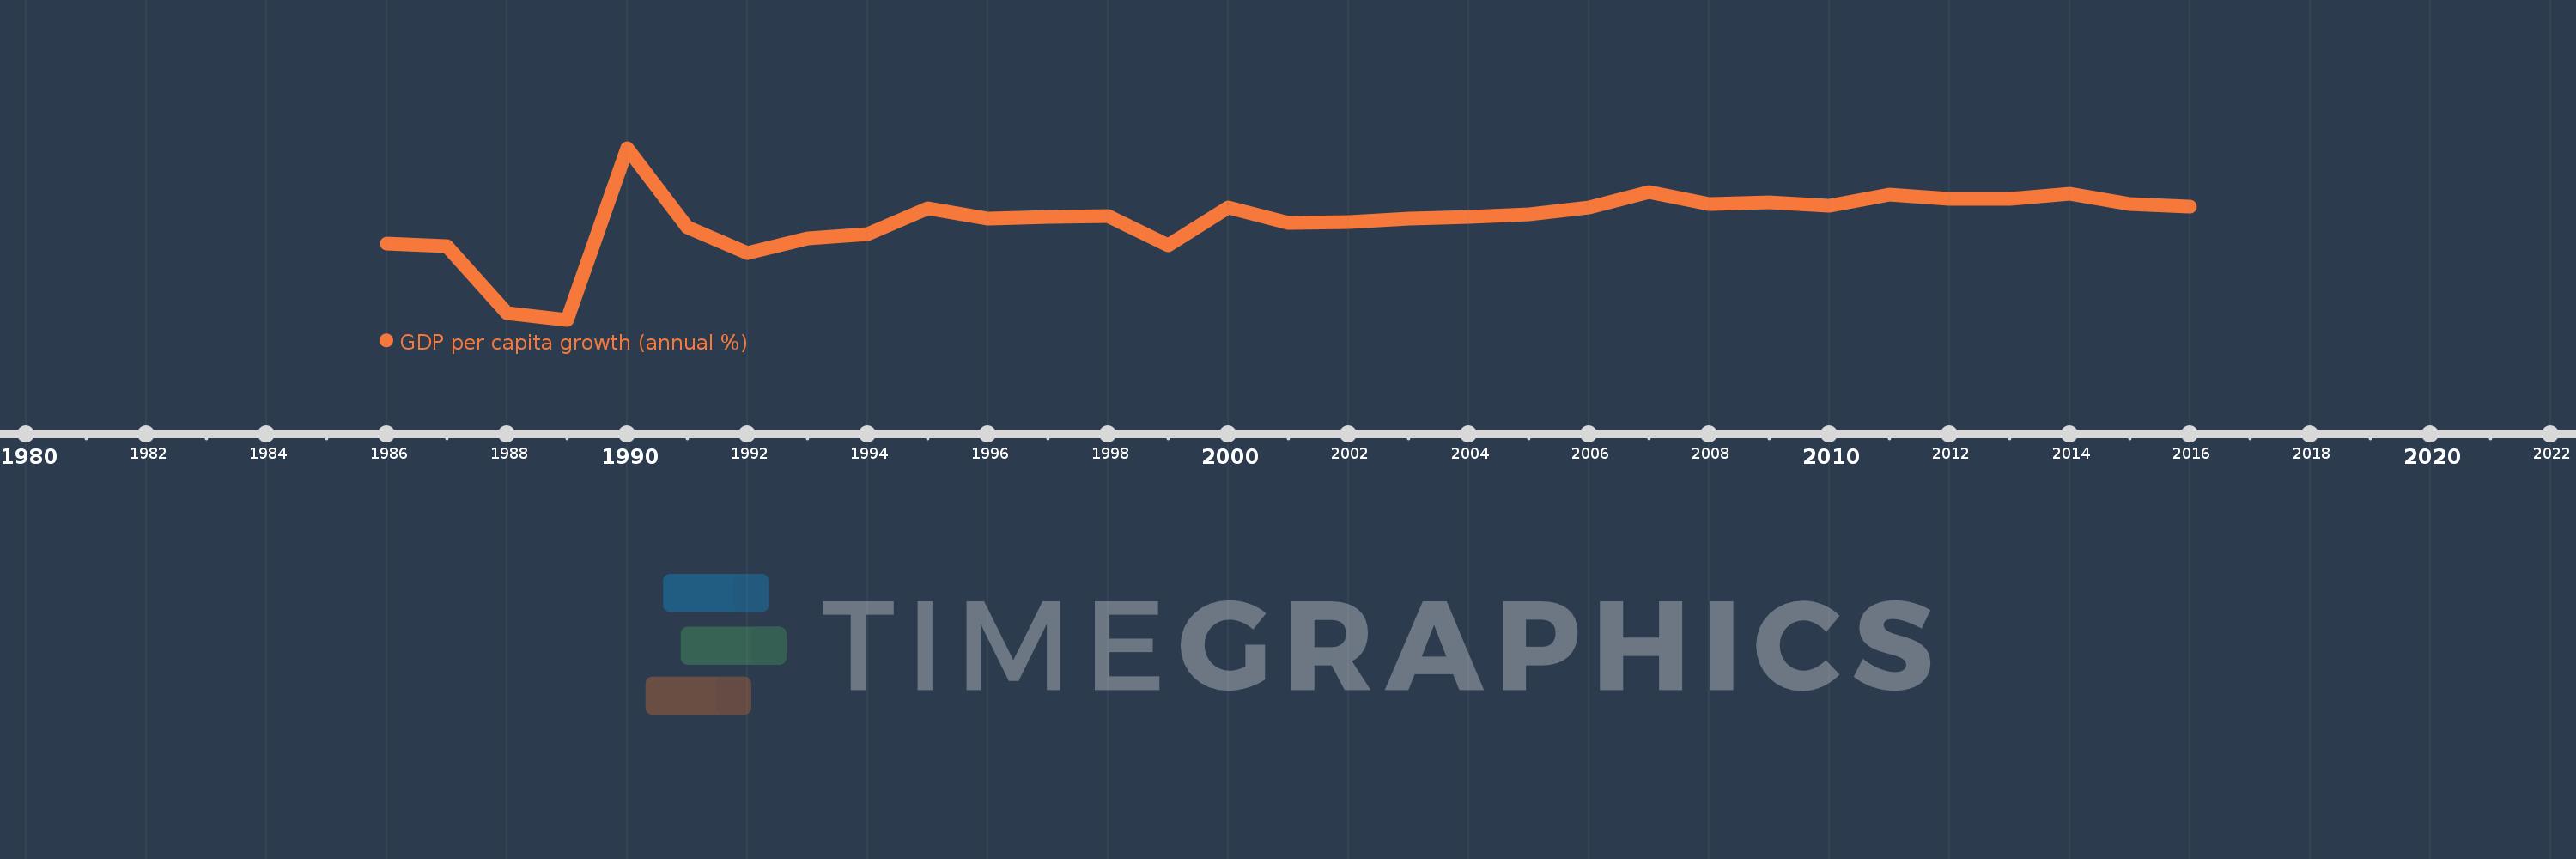
This timeline shows a graph from 1986 to 2016 of Lao PDR. No data until 1985. Number of actual observations by date: 31.
Source name:
World Development Indicators
Source organization:
World Bank national accounts data, and OECD National Accounts data files.
Categories, topics:
Economy & Growth
Last updated:
apr 23, 2017
Indicators value changes by year
Minimum:
-4.798
jan 1, 1989
Maximum:
10.931
jan 1, 1990
At the date of observation
Value
Absolute change
Change from previous value
jan 1, 1986
2.193
+2.193
0.0%
jan 1, 1987
1.973
-0.219
-10.01%
jan 1, 1988
-4.205
-6.179
-313.12%
jan 1, 1989
-4.798
-0.592
14.09%
jan 1, 1990
10.931
+15.729
-327.82%
jan 1, 1991
3.668
-7.263
-66.45%
jan 1, 1992
1.345
-2.322
-63.32%
jan 1, 1993
2.616
+1.271
94.47%
jan 1, 1994
3.055
+0.439
16.78%
jan 1, 1995
5.4
+2.345
76.77%
jan 1, 1996
4.496
-0.904
-16.74%
jan 1, 1997
4.592
+0.096
2.14%
jan 1, 1998
4.714
+0.122
2.66%
jan 1, 1999
2.027
-2.687
-57.0%
jan 1, 2000
5.446
+3.419
168.68%
jan 1, 2001
4.083
-1.363
-25.03%
jan 1, 2002
4.156
+0.074
1.81%
jan 1, 2003
4.424
+0.268
6.44%
jan 1, 2004
4.609
+0.185
4.19%
jan 1, 2005
4.856
+0.247
5.35%
jan 1, 2006
5.502
+0.646
13.3%
jan 1, 2007
6.874
+1.372
24.93%
jan 1, 2008
5.771
-1.103
-16.05%
jan 1, 2009
5.938
+0.167
2.89%
jan 1, 2010
5.62
-0.318
-5.35%
jan 1, 2011
6.665
+1.045
18.6%
jan 1, 2012
6.234
-0.432
-6.47%
jan 1, 2013
6.255
+0.021
0.34%
jan 1, 2014
6.713
+0.458
7.32%
jan 1, 2015
5.76
-0.954
-14.2%
jan 1, 2016
5.571
-0.188
-3.27%
Ranking of countries by current statistics by years


Comments: