29
/
en
AIzaSyAYiBZKx7MnpbEhh9jyipgxe19OcubqV5w
April 1, 2024
250780
St. Lucia
LCA
true
2
1
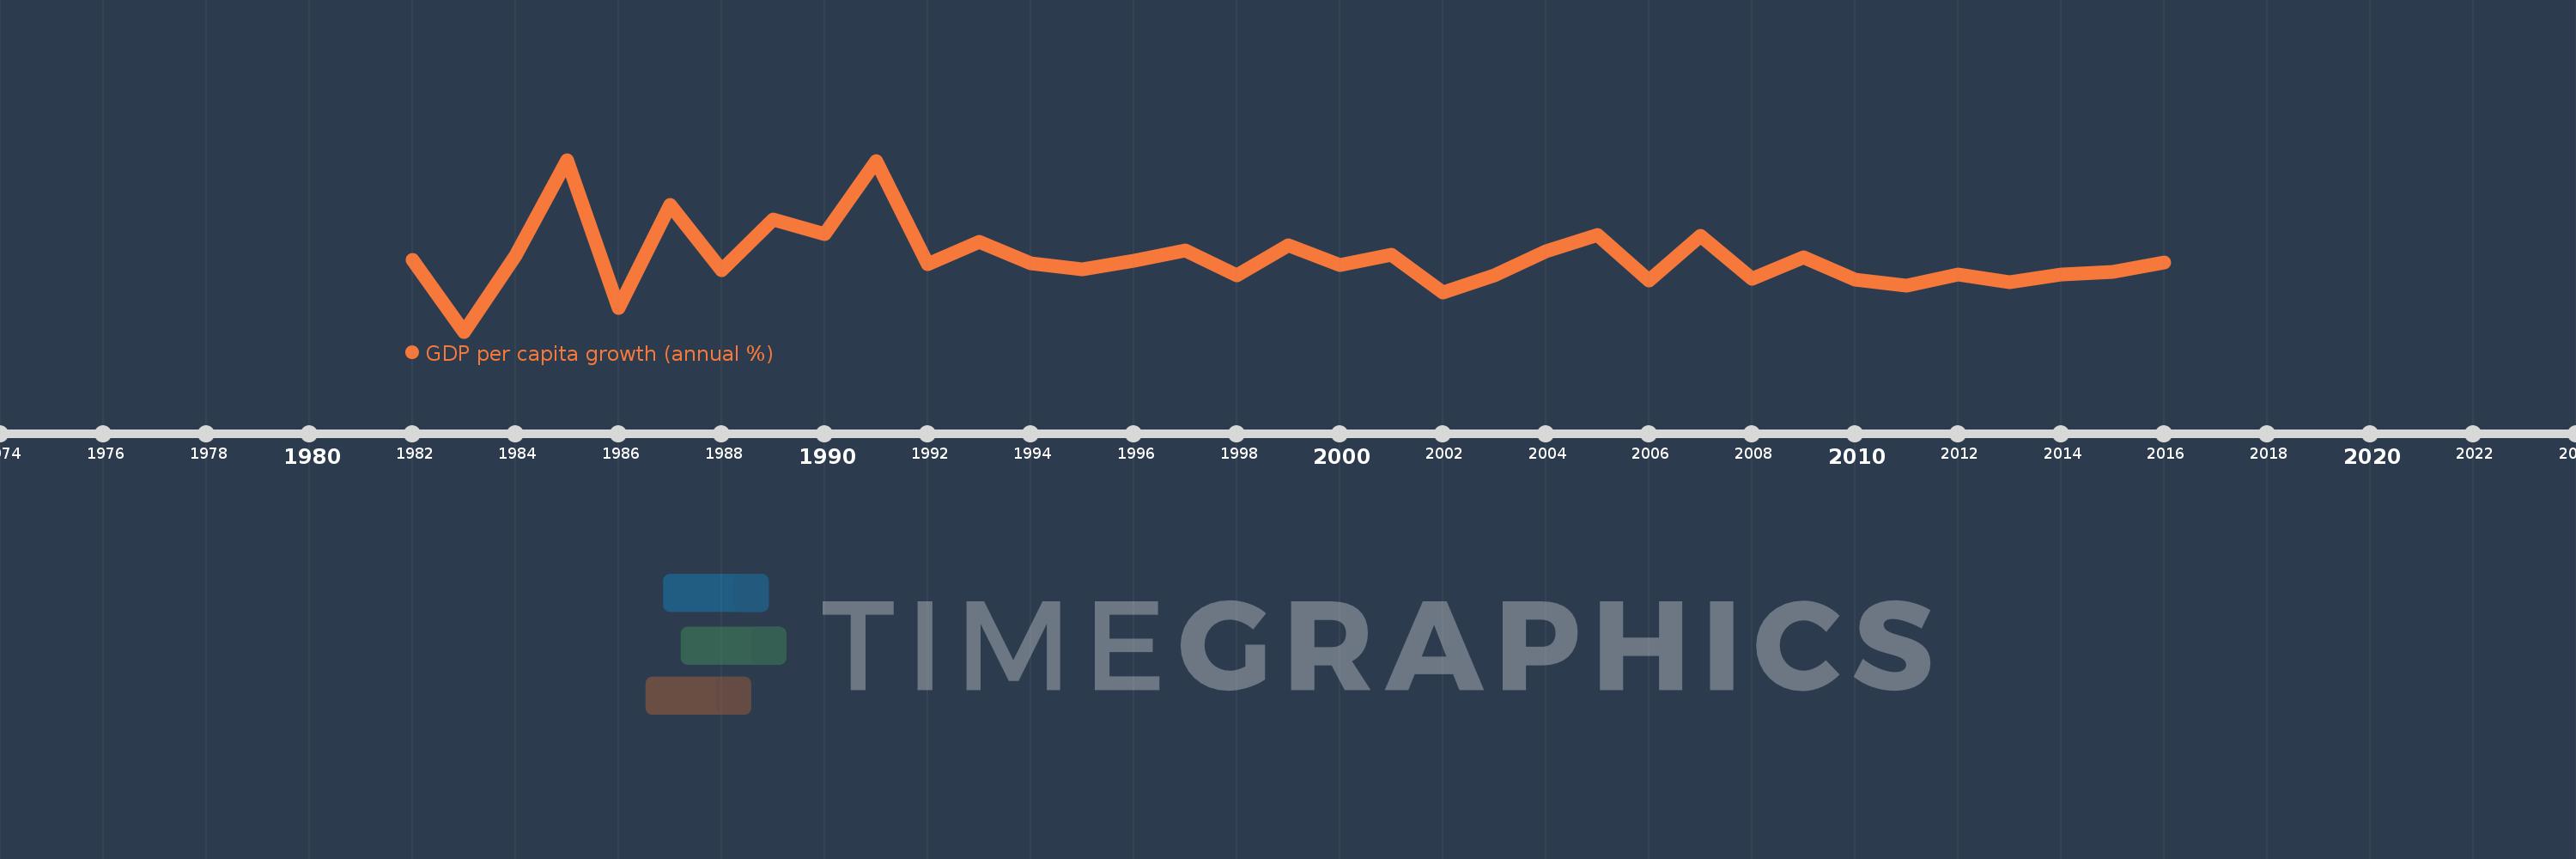
GDP per capita growth (annual %)
2016,2015,2014,2013,2012,2011,2010,2009,2008,2007,2006,2005,2004,2003,2002,2001,2000,1999,1998,1997,1996,1995,1994,1993,1992,1991,1990,1989,1988,1987,1986,1985,1984,1983,1982
This statistics in other country:
AfghanistanAlbaniaAlgeriaAndorraAngolaAntigua and BarbudaArab WorldArgentinaArmeniaArubaAustraliaAustriaAzerbaijanBahamas, TheBahrainBangladeshBarbadosBelarusBelgiumBelizeBeninBermudaBhutanBoliviaBosnia and HerzegovinaBotswanaBrazilBrunei DarussalamBulgariaBurkina FasoBurundiCabo VerdeCambodiaCameroonCanadaCaribbean small statesCayman IslandsCentral African RepublicCentral Europe and the BalticsChadChannel IslandsChileChinaColombiaComorosCongo, Dem. Rep.Congo, Rep.Costa RicaCote d'IvoireCroatiaCubaCyprusCzech RepublicDenmarkDjiboutiDominicaDominican RepublicEarly-demographic dividendEast Asia & PacificEast Asia & Pacific (excluding high income)East Asia & Pacific (IDA & IBRD countries)EcuadorEgypt, Arab Rep.El SalvadorEquatorial GuineaEritreaEstoniaEthiopiaEuro areaEurope & Central AsiaEurope & Central Asia (excluding high income)Europe & Central Asia (IDA & IBRD countries)European UnionFijiFinlandFragile and conflict affected situationsFranceFrench PolynesiaGabonGambia, TheGeorgiaGermanyGhanaGreeceGreenlandGrenadaGuatemalaGuineaGuinea-BissauGuyanaHaitiHeavily indebted poor countries (HIPC)High incomeHondurasHong Kong SAR, ChinaHungaryIBRD onlyIcelandIDA & IBRD totalIDA blendIDA onlyIDA totalIndiaIndonesiaIran, Islamic Rep.IraqIrelandIsle of ManIsraelItalyJamaicaJapanJordanKazakhstanKenyaKiribatiKorea, Rep.KosovoKuwaitKyrgyz RepublicLao PDRLate-demographic dividendLatin America & Caribbean Latin America & Caribbean (excluding high income)Latin America & the Caribbean (IDA & IBRD countries)LatviaLeast developed countries: UN classificationLebanonLesothoLiberiaLibyaLiechtensteinLithuaniaLow & middle incomeLow incomeLower middle incomeLuxembourgMacao SAR, ChinaMacedonia, FYRMadagascarMalawiMalaysiaMaldivesMaliMaltaMarshall IslandsMauritaniaMauritiusMexicoMicronesia, Fed. Sts.Middle East & North AfricaMiddle East & North Africa (excluding high income)Middle East & North Africa (IDA & IBRD countries)Middle incomeMoldovaMonacoMongoliaMontenegroMoroccoMozambiqueMyanmarNamibiaNauruNepalNetherlandsNew CaledoniaNew ZealandNicaraguaNigerNigeriaNorth AmericaNorwayOECD membersOmanOther small statesPacific island small statesPakistanPalauPanamaPapua New GuineaParaguayPeruPhilippinesPolandPortugalPost-demographic dividendPre-demographic dividendPuerto RicoQatarRomaniaRussian FederationRwandaSamoaSan MarinoSao Tome and PrincipeSaudi ArabiaSenegalSerbiaSeychellesSierra LeoneSingaporeSlovak RepublicSloveniaSmall statesSolomon IslandsSomaliaSouth AfricaSouth AsiaSouth Asia (IDA & IBRD)South SudanSpainSri LankaSt. Kitts and NevisSt. LuciaSt. Vincent and the GrenadinesSub-Saharan Africa Sub-Saharan Africa (excluding high income)Sub-Saharan Africa (IDA & IBRD countries)SudanSurinameSwazilandSwedenSwitzerlandSyrian Arab RepublicTajikistanTanzaniaThailandTimor-LesteTogoTongaTrinidad and TobagoTunisiaTurkeyTurkmenistanTuvaluUgandaUkraineUnited Arab EmiratesUnited KingdomUnited StatesUpper middle incomeUruguayUzbekistanVanuatuVenezuela, RBVietnamVirgin Islands (U.S.)West Bank and GazaWorldYemen, Rep.ZambiaZimbabwe Timeline:
This timeline shows a graph from 1982 to 2016 of St. Lucia. No data until 1981. Number of actual observations by date: 35.
Source name:
World Development Indicators
Source organization:
World Bank national accounts data, and OECD National Accounts data files.
Categories, topics:
Economy & Growth
Last updated:
apr 23, 2017
Indicators value changes by year
Minimum:
-11.968
jan 1, 1983
Maximum:
21.786
jan 1, 1985
At the date of observation
Value
Absolute change
Change from previous value
jan 1, 1982
2.118
+2.118
0.0%
jan 1, 1983
-11.968
-14.085
-665.15%
jan 1, 1984
2.902
+14.87
-124.25%
jan 1, 1985
21.786
+18.883
650.69%
jan 1, 1986
-7.259
-29.045
-133.32%
jan 1, 1987
12.909
+20.168
-277.83%
jan 1, 1988
0.059
-12.85
-99.55%
jan 1, 1989
10.068
+10.009
17.07K%
jan 1, 1990
7.121
-2.947
-29.27%
jan 1, 1991
21.555
+14.434
202.7%
jan 1, 1992
1.228
-20.326
-94.3%
jan 1, 1993
5.683
+4.455
362.75%
jan 1, 1994
1.389
-4.295
-75.57%
jan 1, 1995
0.255
-1.133
-81.62%
jan 1, 1996
2.039
+1.784
698.95%
jan 1, 1997
4.057
+2.018
98.98%
jan 1, 1998
-0.948
-5.005
-123.35%
jan 1, 1999
4.913
+5.861
-618.56%
jan 1, 2000
1.034
-3.88
-78.96%
jan 1, 2001
3.172
+2.139
206.86%
jan 1, 2002
-4.266
-7.439
-234.48%
jan 1, 2003
-0.934
+3.333
-78.11%
jan 1, 2004
3.78
+4.714
-504.85%
jan 1, 2005
7.093
+3.313
87.64%
jan 1, 2006
-1.954
-9.047
-127.54%
jan 1, 2007
6.771
+8.725
-446.58%
jan 1, 2008
-1.636
-8.407
-124.17%
jan 1, 2009
2.619
+4.256
-260.07%
jan 1, 2010
-1.761
-4.381
-167.24%
jan 1, 2011
-2.918
-1.157
65.69%
jan 1, 2012
-0.813
+2.105
-72.13%
jan 1, 2013
-2.327
-1.513
186.08%
jan 1, 2014
-0.714
+1.613
-69.31%
jan 1, 2015
-0.296
+0.418
-58.6%
jan 1, 2016
1.621
+1.916
-648.17%
Ranking of countries by current statistics by years


Comments: