29
/
en
AIzaSyAYiBZKx7MnpbEhh9jyipgxe19OcubqV5w
April 1, 2024
205267
Namibia
NAM
true
2
1
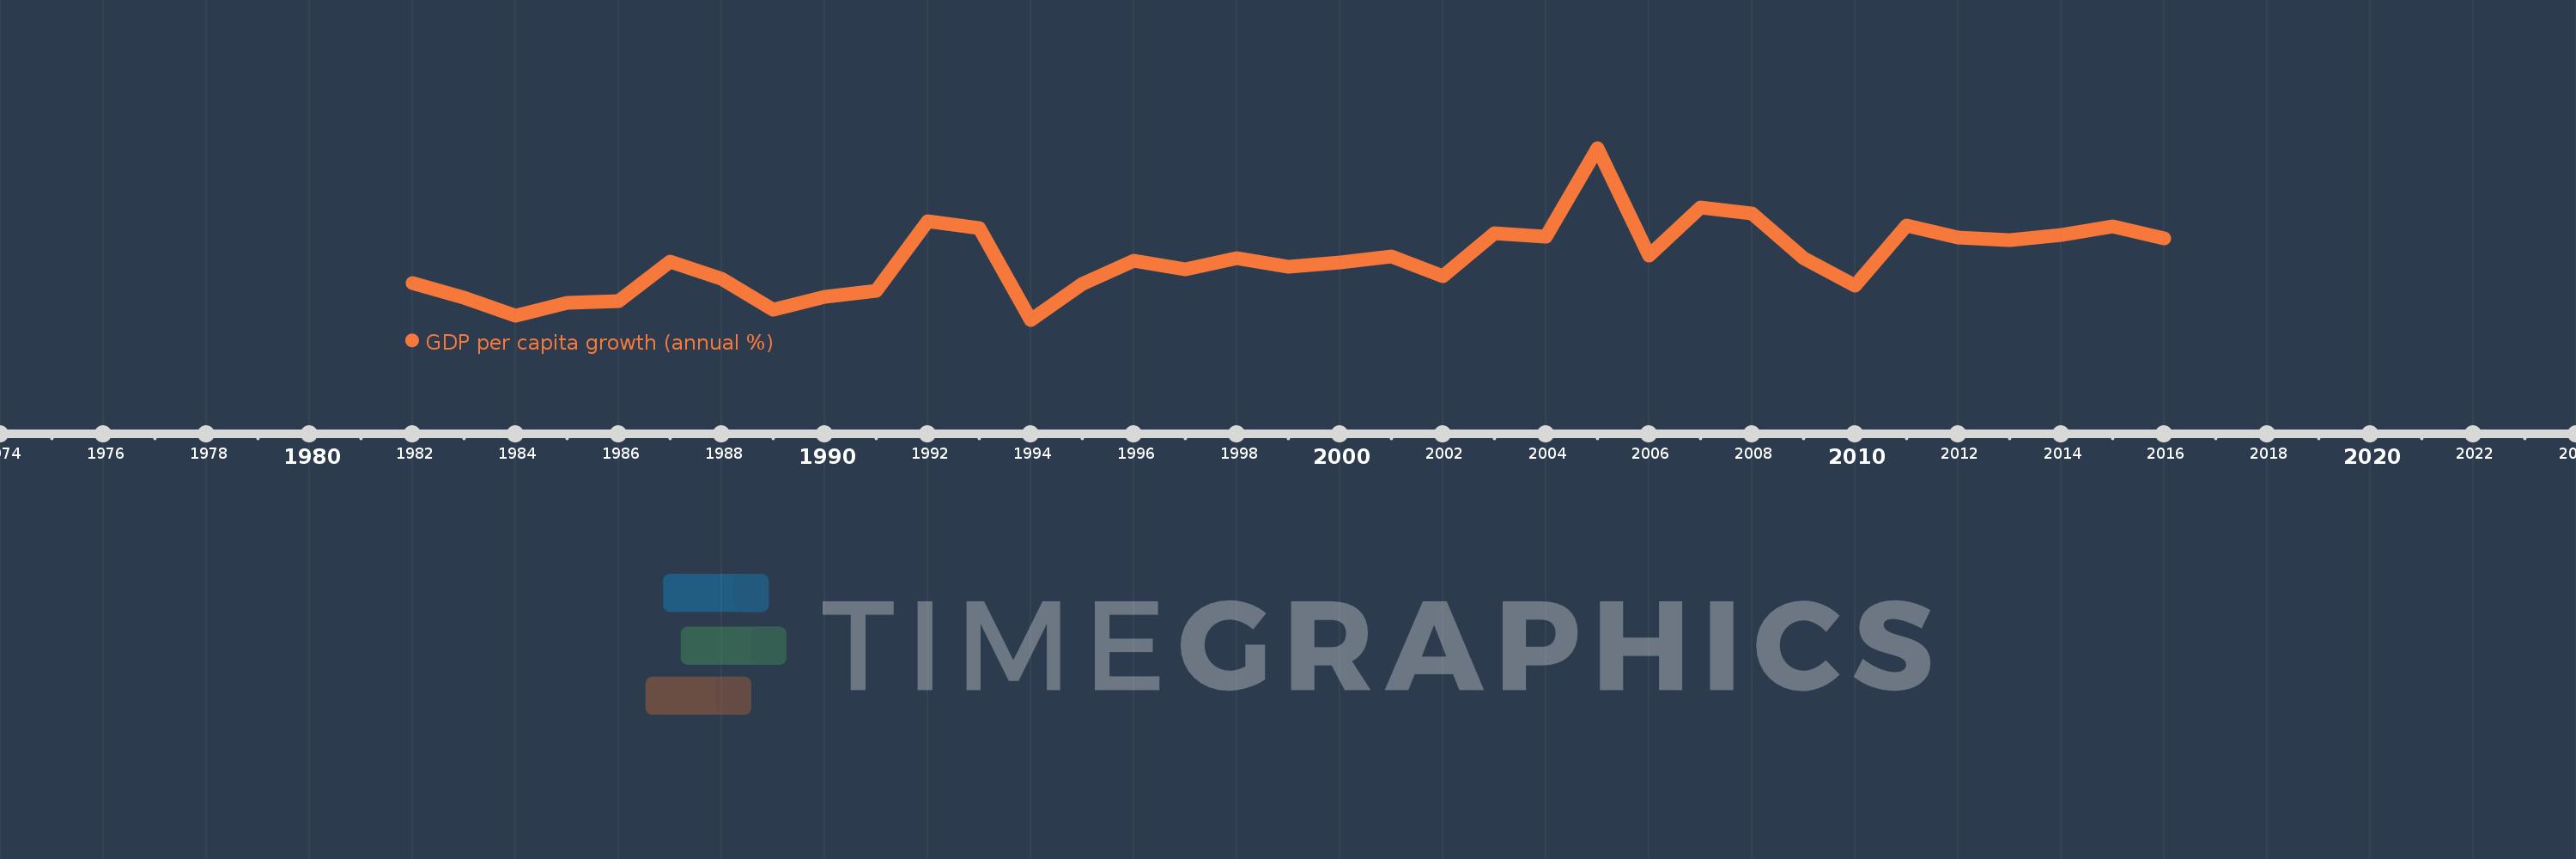
GDP per capita growth (annual %)
2016,2015,2014,2013,2012,2011,2010,2009,2008,2007,2006,2005,2004,2003,2002,2001,2000,1999,1998,1997,1996,1995,1994,1993,1992,1991,1990,1989,1988,1987,1986,1985,1984,1983,1982
This statistics in other country:
AfghanistanAlbaniaAlgeriaAndorraAngolaAntigua and BarbudaArab WorldArgentinaArmeniaArubaAustraliaAustriaAzerbaijanBahamas, TheBahrainBangladeshBarbadosBelarusBelgiumBelizeBeninBermudaBhutanBoliviaBosnia and HerzegovinaBotswanaBrazilBrunei DarussalamBulgariaBurkina FasoBurundiCabo VerdeCambodiaCameroonCanadaCaribbean small statesCayman IslandsCentral African RepublicCentral Europe and the BalticsChadChannel IslandsChileChinaColombiaComorosCongo, Dem. Rep.Congo, Rep.Costa RicaCote d'IvoireCroatiaCubaCyprusCzech RepublicDenmarkDjiboutiDominicaDominican RepublicEarly-demographic dividendEast Asia & PacificEast Asia & Pacific (excluding high income)East Asia & Pacific (IDA & IBRD countries)EcuadorEgypt, Arab Rep.El SalvadorEquatorial GuineaEritreaEstoniaEthiopiaEuro areaEurope & Central AsiaEurope & Central Asia (excluding high income)Europe & Central Asia (IDA & IBRD countries)European UnionFijiFinlandFragile and conflict affected situationsFranceFrench PolynesiaGabonGambia, TheGeorgiaGermanyGhanaGreeceGreenlandGrenadaGuatemalaGuineaGuinea-BissauGuyanaHaitiHeavily indebted poor countries (HIPC)High incomeHondurasHong Kong SAR, ChinaHungaryIBRD onlyIcelandIDA & IBRD totalIDA blendIDA onlyIDA totalIndiaIndonesiaIran, Islamic Rep.IraqIrelandIsle of ManIsraelItalyJamaicaJapanJordanKazakhstanKenyaKiribatiKorea, Rep.KosovoKuwaitKyrgyz RepublicLao PDRLate-demographic dividendLatin America & Caribbean Latin America & Caribbean (excluding high income)Latin America & the Caribbean (IDA & IBRD countries)LatviaLeast developed countries: UN classificationLebanonLesothoLiberiaLibyaLiechtensteinLithuaniaLow & middle incomeLow incomeLower middle incomeLuxembourgMacao SAR, ChinaMacedonia, FYRMadagascarMalawiMalaysiaMaldivesMaliMaltaMarshall IslandsMauritaniaMauritiusMexicoMicronesia, Fed. Sts.Middle East & North AfricaMiddle East & North Africa (excluding high income)Middle East & North Africa (IDA & IBRD countries)Middle incomeMoldovaMonacoMongoliaMontenegroMoroccoMozambiqueMyanmarNamibiaNauruNepalNetherlandsNew CaledoniaNew ZealandNicaraguaNigerNigeriaNorth AmericaNorwayOECD membersOmanOther small statesPacific island small statesPakistanPalauPanamaPapua New GuineaParaguayPeruPhilippinesPolandPortugalPost-demographic dividendPre-demographic dividendPuerto RicoQatarRomaniaRussian FederationRwandaSamoaSan MarinoSao Tome and PrincipeSaudi ArabiaSenegalSerbiaSeychellesSierra LeoneSingaporeSlovak RepublicSloveniaSmall statesSolomon IslandsSomaliaSouth AfricaSouth AsiaSouth Asia (IDA & IBRD)South SudanSpainSri LankaSt. Kitts and NevisSt. LuciaSt. Vincent and the GrenadinesSub-Saharan Africa Sub-Saharan Africa (excluding high income)Sub-Saharan Africa (IDA & IBRD countries)SudanSurinameSwazilandSwedenSwitzerlandSyrian Arab RepublicTajikistanTanzaniaThailandTimor-LesteTogoTongaTrinidad and TobagoTunisiaTurkeyTurkmenistanTuvaluUgandaUkraineUnited Arab EmiratesUnited KingdomUnited StatesUpper middle incomeUruguayUzbekistanVanuatuVenezuela, RBVietnamVirgin Islands (U.S.)West Bank and GazaWorldYemen, Rep.ZambiaZimbabwe Timeline:
This timeline shows a graph from 1982 to 2016 of Namibia. No data until 1981. Number of actual observations by date: 35.
Source name:
World Development Indicators
Source organization:
World Bank national accounts data, and OECD National Accounts data files.
Categories, topics:
Economy & Growth
Last updated:
apr 23, 2017
Indicators value changes by year
Minimum:
-4.469
jan 1, 1994
Maximum:
11.024
jan 1, 2005
At the date of observation
Value
Absolute change
Change from previous value
jan 1, 1982
-1.145
-1.145
0.0%
jan 1, 1983
-2.501
-1.356
118.39%
jan 1, 1984
-4.091
-1.59
63.56%
jan 1, 1985
-2.956
+1.135
-27.75%
jan 1, 1986
-2.8
+0.155
-5.26%
jan 1, 1987
0.788
+3.588
-128.14%
jan 1, 1988
-0.798
-1.586
-201.32%
jan 1, 1989
-3.57
-2.772
347.17%
jan 1, 1990
-2.411
+1.16
-32.48%
jan 1, 1991
-1.884
+0.527
-21.86%
jan 1, 1992
4.425
+6.308
-334.91%
jan 1, 1993
3.823
-0.602
-13.6%
jan 1, 1994
-4.469
-8.293
-216.91%
jan 1, 1995
-1.206
+3.263
-73.01%
jan 1, 1996
0.86
+2.066
-171.29%
jan 1, 1997
0.097
-0.763
-88.71%
jan 1, 1998
1.093
+0.996
1.03K%
jan 1, 1999
0.334
-0.759
-69.44%
jan 1, 2000
0.731
+0.397
118.89%
jan 1, 2001
1.277
+0.545
74.57%
jan 1, 2002
-0.554
-1.83
-143.39%
jan 1, 2003
3.357
+3.911
-706.14%
jan 1, 2004
3.041
-0.316
-9.43%
jan 1, 2005
11.024
+7.984
262.55%
jan 1, 2006
1.301
-9.723
-88.2%
jan 1, 2007
5.671
+4.37
335.89%
jan 1, 2008
5.12
-0.552
-9.73%
jan 1, 2009
1.072
-4.048
-79.07%
jan 1, 2010
-1.412
-2.484
-231.77%
jan 1, 2011
4.044
+5.456
-386.36%
jan 1, 2012
2.909
-1.134
-28.06%
jan 1, 2013
2.701
-0.208
-7.14%
jan 1, 2014
3.18
+0.479
17.73%
jan 1, 2015
3.966
+0.786
24.7%
jan 1, 2016
2.898
-1.068
-26.92%
Ranking of countries by current statistics by years


Comments: