29
/
en
AIzaSyAYiBZKx7MnpbEhh9jyipgxe19OcubqV5w
April 1, 2024
131995
Fiji
FJI
true
2
1
GDP per capita growth (annual %)
2016,2015,2014,2013,2012,2011,2010,2009,2008,2007,2006,2005,2004,2003,2002,2001,2000,1999,1998,1997,1996,1995,1994,1993,1992,1991,1990,1989,1988,1987,1986,1985,1984,1983,1982,1981,1980,1979,1978,1977,1976,1975,1974,1973,1972,1971,1970,1969,1968,1967,1966,1965,1964,1963,1962
This statistics in other country:
AfghanistanAlbaniaAlgeriaAndorraAngolaAntigua and BarbudaArab WorldArgentinaArmeniaArubaAustraliaAustriaAzerbaijanBahamas, TheBahrainBangladeshBarbadosBelarusBelgiumBelizeBeninBermudaBhutanBoliviaBosnia and HerzegovinaBotswanaBrazilBrunei DarussalamBulgariaBurkina FasoBurundiCabo VerdeCambodiaCameroonCanadaCaribbean small statesCayman IslandsCentral African RepublicCentral Europe and the BalticsChadChannel IslandsChileChinaColombiaComorosCongo, Dem. Rep.Congo, Rep.Costa RicaCote d'IvoireCroatiaCubaCyprusCzech RepublicDenmarkDjiboutiDominicaDominican RepublicEarly-demographic dividendEast Asia & PacificEast Asia & Pacific (excluding high income)East Asia & Pacific (IDA & IBRD countries)EcuadorEgypt, Arab Rep.El SalvadorEquatorial GuineaEritreaEstoniaEthiopiaEuro areaEurope & Central AsiaEurope & Central Asia (excluding high income)Europe & Central Asia (IDA & IBRD countries)European UnionFijiFinlandFragile and conflict affected situationsFranceFrench PolynesiaGabonGambia, TheGeorgiaGermanyGhanaGreeceGreenlandGrenadaGuatemalaGuineaGuinea-BissauGuyanaHaitiHeavily indebted poor countries (HIPC)High incomeHondurasHong Kong SAR, ChinaHungaryIBRD onlyIcelandIDA & IBRD totalIDA blendIDA onlyIDA totalIndiaIndonesiaIran, Islamic Rep.IraqIrelandIsle of ManIsraelItalyJamaicaJapanJordanKazakhstanKenyaKiribatiKorea, Rep.KosovoKuwaitKyrgyz RepublicLao PDRLate-demographic dividendLatin America & Caribbean Latin America & Caribbean (excluding high income)Latin America & the Caribbean (IDA & IBRD countries)LatviaLeast developed countries: UN classificationLebanonLesothoLiberiaLibyaLiechtensteinLithuaniaLow & middle incomeLow incomeLower middle incomeLuxembourgMacao SAR, ChinaMacedonia, FYRMadagascarMalawiMalaysiaMaldivesMaliMaltaMarshall IslandsMauritaniaMauritiusMexicoMicronesia, Fed. Sts.Middle East & North AfricaMiddle East & North Africa (excluding high income)Middle East & North Africa (IDA & IBRD countries)Middle incomeMoldovaMonacoMongoliaMontenegroMoroccoMozambiqueMyanmarNamibiaNauruNepalNetherlandsNew CaledoniaNew ZealandNicaraguaNigerNigeriaNorth AmericaNorwayOECD membersOmanOther small statesPacific island small statesPakistanPalauPanamaPapua New GuineaParaguayPeruPhilippinesPolandPortugalPost-demographic dividendPre-demographic dividendPuerto RicoQatarRomaniaRussian FederationRwandaSamoaSan MarinoSao Tome and PrincipeSaudi ArabiaSenegalSerbiaSeychellesSierra LeoneSingaporeSlovak RepublicSloveniaSmall statesSolomon IslandsSomaliaSouth AfricaSouth AsiaSouth Asia (IDA & IBRD)South SudanSpainSri LankaSt. Kitts and NevisSt. LuciaSt. Vincent and the GrenadinesSub-Saharan Africa Sub-Saharan Africa (excluding high income)Sub-Saharan Africa (IDA & IBRD countries)SudanSurinameSwazilandSwedenSwitzerlandSyrian Arab RepublicTajikistanTanzaniaThailandTimor-LesteTogoTongaTrinidad and TobagoTunisiaTurkeyTurkmenistanTuvaluUgandaUkraineUnited Arab EmiratesUnited KingdomUnited StatesUpper middle incomeUruguayUzbekistanVanuatuVenezuela, RBVietnamVirgin Islands (U.S.)West Bank and GazaWorldYemen, Rep.ZambiaZimbabwe Timeline:
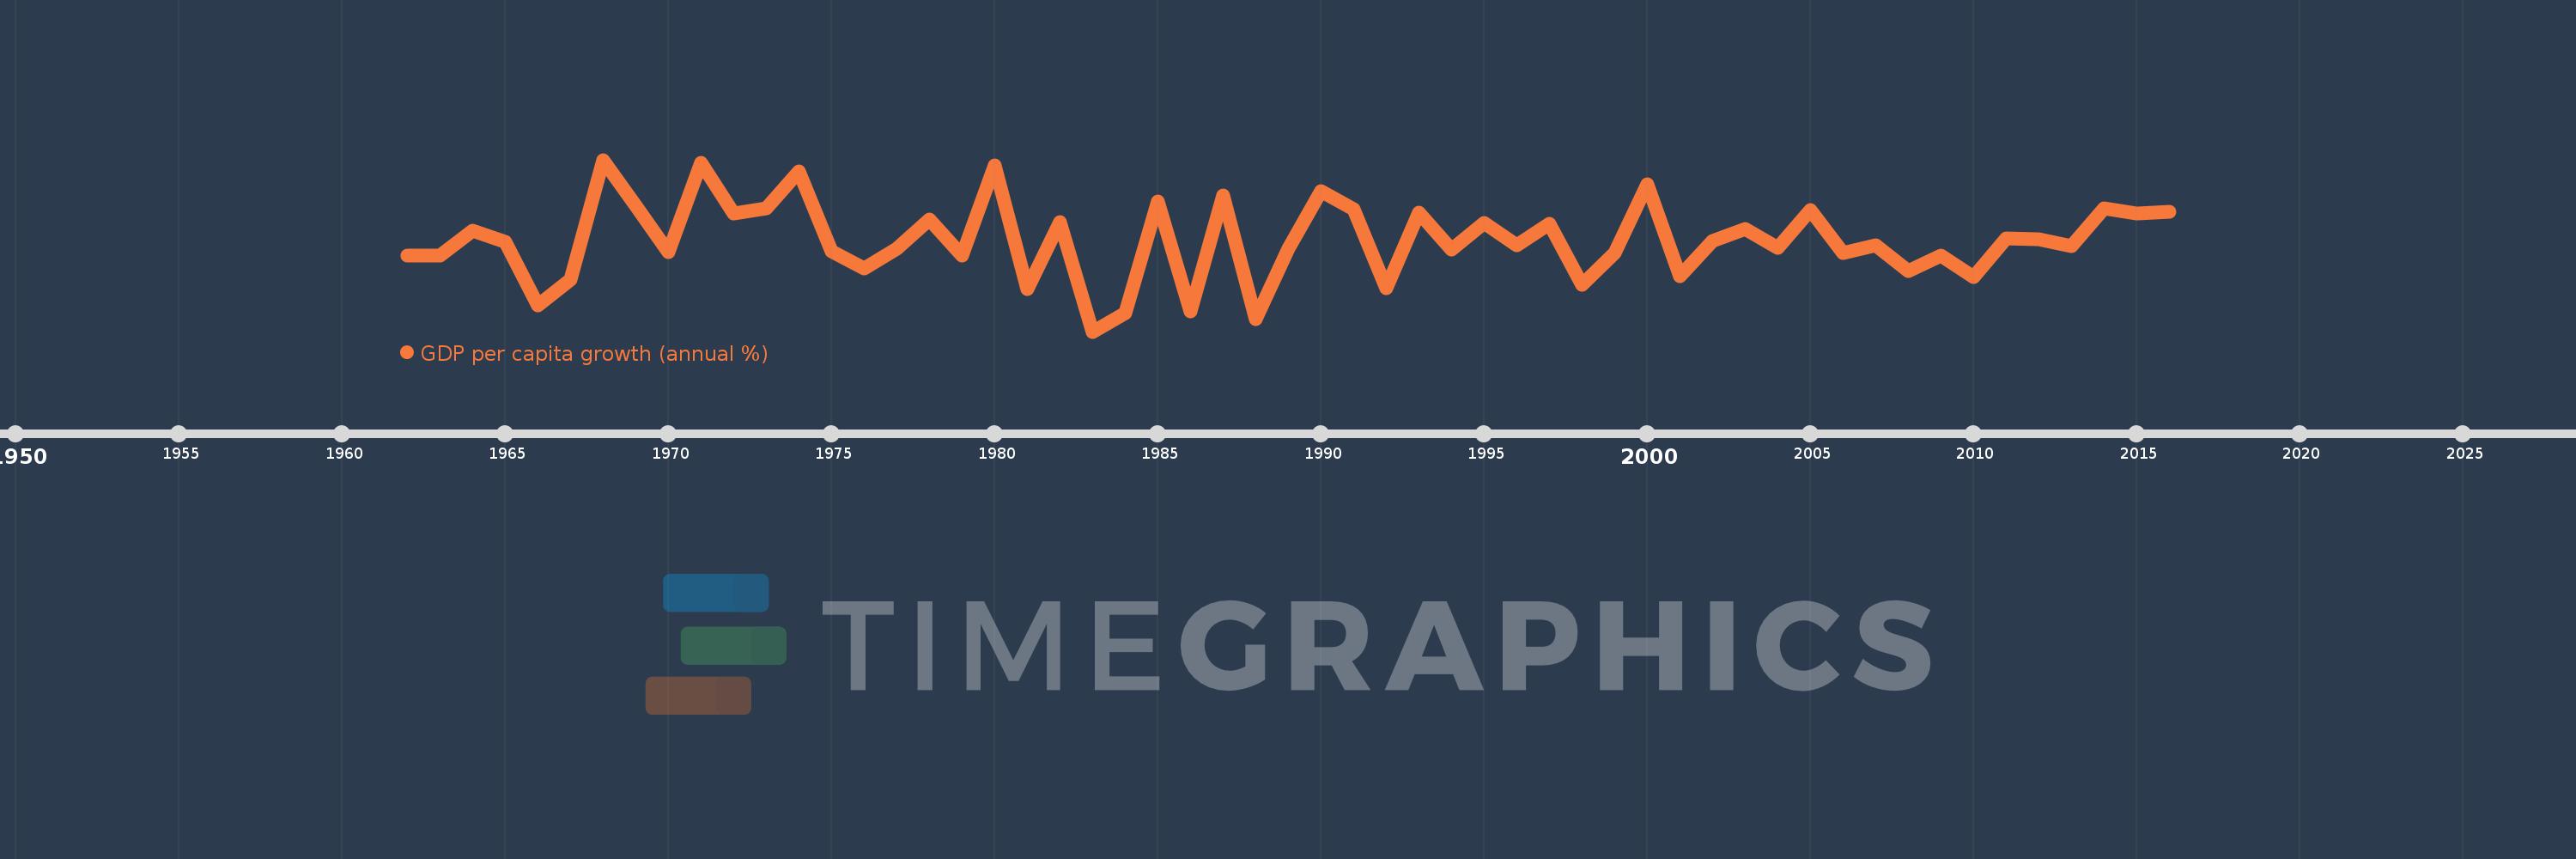
This timeline shows a graph from 1962 to 2016 of Fiji. No data until 1961. Number of actual observations by date: 55.
Source name:
World Development Indicators
Source organization:
World Bank national accounts data, and OECD National Accounts data files.
Categories, topics:
Economy & Growth
Last updated:
apr 23, 2017
Indicators value changes by year
Minimum:
-8.404
jan 1, 1983
Maximum:
10.661
jan 1, 1968
At the date of observation
Value
Absolute change
Change from previous value
jan 1, 1962
0.017
+0.017
0.0%
jan 1, 1963
0.061
+0.044
263.88%
jan 1, 1964
2.791
+2.73
4.46K%
jan 1, 1965
1.561
-1.23
-44.08%
jan 1, 1966
-5.518
-7.079
-453.49%
jan 1, 1967
-2.613
+2.905
-52.65%
jan 1, 1968
10.661
+13.274
-508.05%
jan 1, 1969
5.542
-5.119
-48.02%
jan 1, 1970
0.428
-5.114
-92.28%
jan 1, 1971
10.349
+9.921
2.32K%
jan 1, 1972
4.663
-5.686
-54.95%
jan 1, 1973
5.266
+0.603
12.93%
jan 1, 1974
9.337
+4.072
77.33%
jan 1, 1975
0.555
-8.782
-94.06%
jan 1, 1976
-1.424
-1.978
-356.64%
jan 1, 1977
0.825
+2.248
-157.93%
jan 1, 1978
4.004
+3.179
385.45%
jan 1, 1979
0.01
-3.994
-99.76%
jan 1, 1980
10.023
+10.014
105.31K%
jan 1, 1981
-3.728
-13.751
-137.19%
jan 1, 1982
3.765
+7.493
-201.01%
jan 1, 1983
-8.404
-12.17
-323.2%
jan 1, 1984
-6.369
+2.035
-24.21%
jan 1, 1985
6.075
+12.444
-195.38%
jan 1, 1986
-6.128
-12.203
-200.87%
jan 1, 1987
6.717
+12.845
-209.63%
jan 1, 1988
-7.026
-13.744
-204.59%
jan 1, 1989
0.789
+7.815
-111.23%
jan 1, 1990
7.186
+6.397
810.56%
jan 1, 1991
5.219
-1.967
-27.37%
jan 1, 1992
-3.605
-8.824
-169.08%
jan 1, 1993
4.808
+8.413
-233.36%
jan 1, 1994
0.711
-4.097
-85.21%
jan 1, 1995
3.639
+2.928
411.79%
jan 1, 1996
1.2
-2.439
-67.01%
jan 1, 1997
3.6
+2.4
199.9%
jan 1, 1998
-3.234
-6.834
-189.82%
jan 1, 1999
0.356
+3.59
-111.02%
jan 1, 2000
7.966
+7.61
2.14K%
jan 1, 2001
-2.273
-10.239
-128.53%
jan 1, 2002
1.625
+3.898
-171.5%
jan 1, 2003
3.013
+1.388
85.41%
jan 1, 2004
0.884
-2.129
-70.65%
jan 1, 2005
5.078
+4.193
474.15%
jan 1, 2006
0.275
-4.802
-94.58%
jan 1, 2007
1.167
+0.891
323.64%
jan 1, 2008
-1.722
-2.889
-247.61%
jan 1, 2009
0.017
+1.739
-100.99%
jan 1, 2010
-2.387
-2.404
-14.08K%
jan 1, 2011
1.985
+4.372
-183.16%
jan 1, 2012
1.832
-0.153
-7.72%
jan 1, 2013
1.087
-0.745
-40.64%
jan 1, 2014
5.318
+4.231
389.09%
jan 1, 2015
4.737
-0.581
-10.92%
jan 1, 2016
4.89
+0.152
3.22%
Ranking of countries by current statistics by years


Comments: