29
/
en
AIzaSyAYiBZKx7MnpbEhh9jyipgxe19OcubqV5w
April 1, 2024
155989
Indonesia
IDN
true
2
1
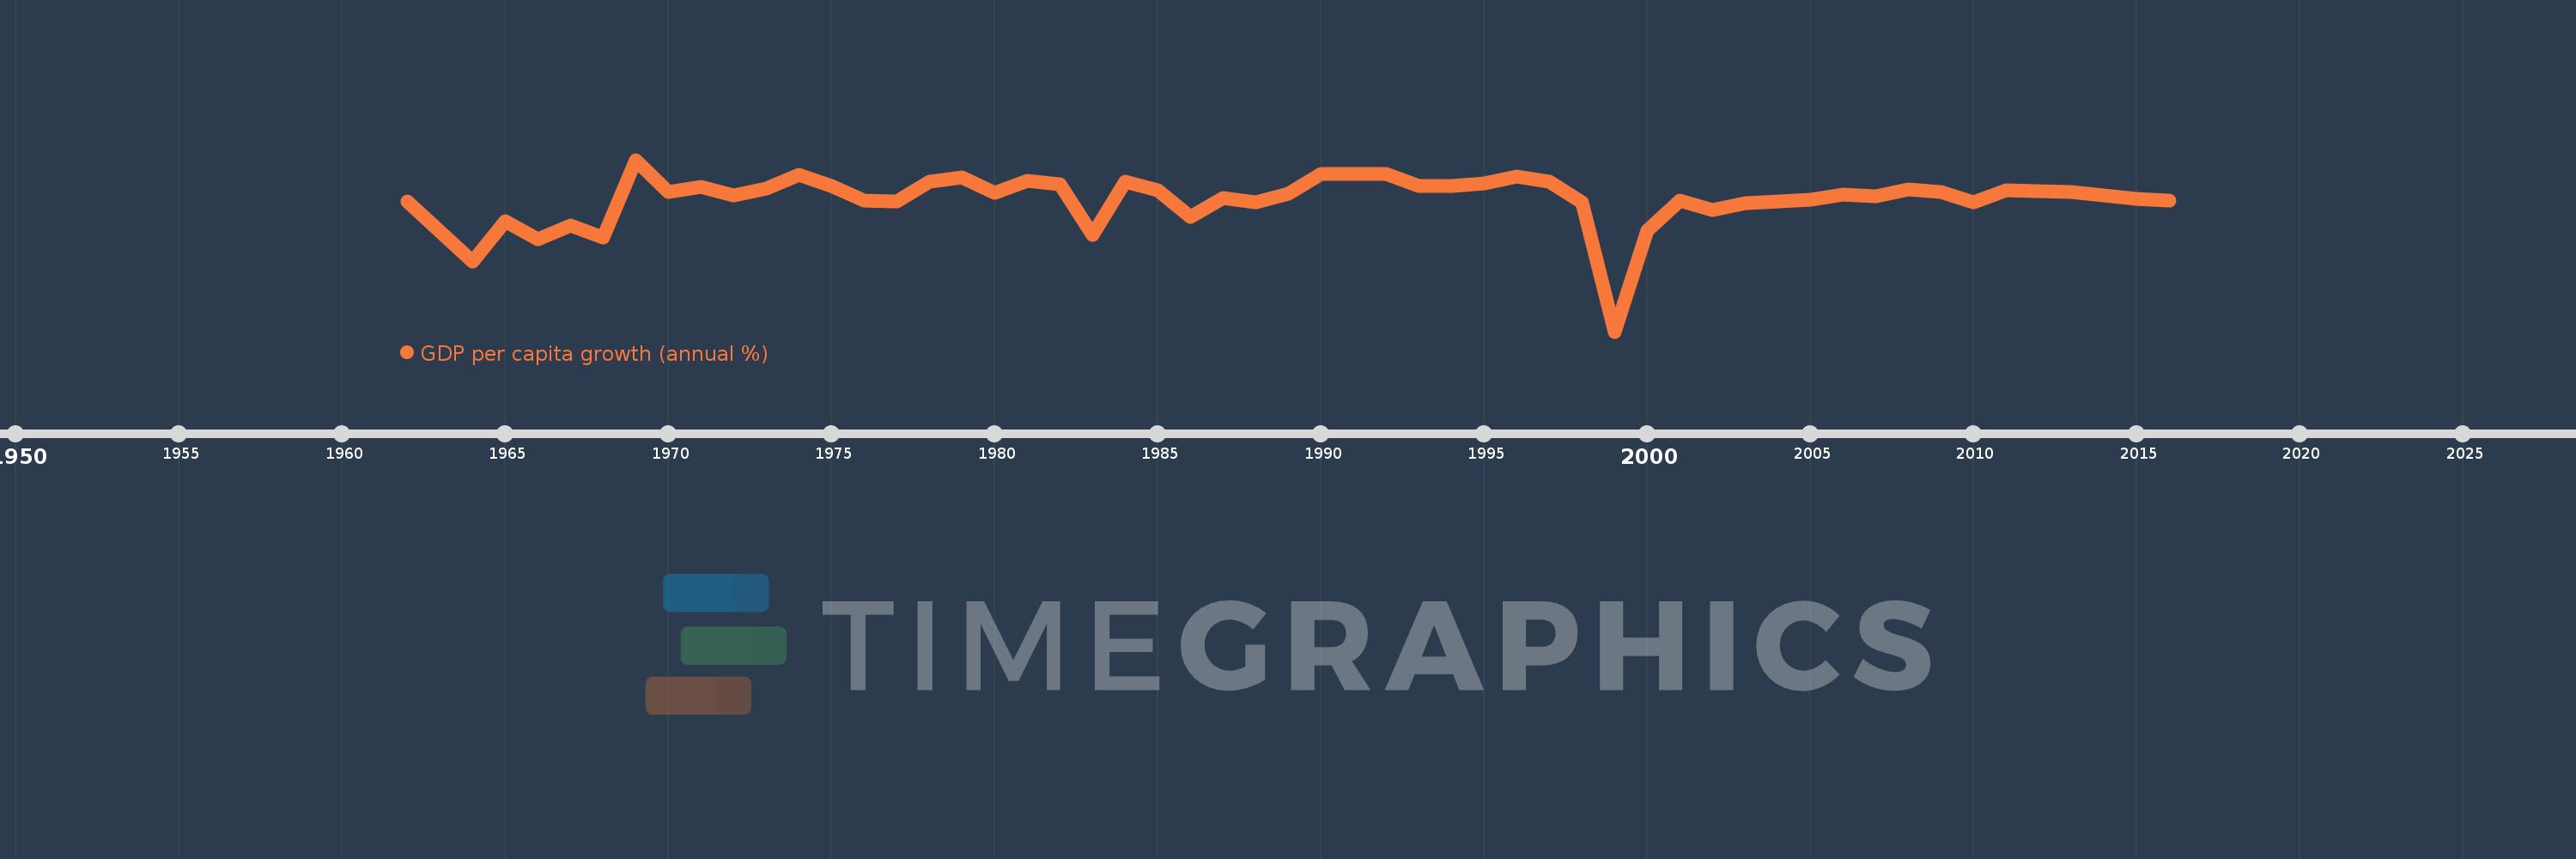
GDP per capita growth (annual %)
2016,2015,2014,2013,2012,2011,2010,2009,2008,2007,2006,2005,2004,2003,2002,2001,2000,1999,1998,1997,1996,1995,1994,1993,1992,1991,1990,1989,1988,1987,1986,1985,1984,1983,1982,1981,1980,1979,1978,1977,1976,1975,1974,1973,1972,1971,1970,1969,1968,1967,1966,1965,1964,1963,1962
This statistics in other country:
AfghanistanAlbaniaAlgeriaAndorraAngolaAntigua and BarbudaArab WorldArgentinaArmeniaArubaAustraliaAustriaAzerbaijanBahamas, TheBahrainBangladeshBarbadosBelarusBelgiumBelizeBeninBermudaBhutanBoliviaBosnia and HerzegovinaBotswanaBrazilBrunei DarussalamBulgariaBurkina FasoBurundiCabo VerdeCambodiaCameroonCanadaCaribbean small statesCayman IslandsCentral African RepublicCentral Europe and the BalticsChadChannel IslandsChileChinaColombiaComorosCongo, Dem. Rep.Congo, Rep.Costa RicaCote d'IvoireCroatiaCubaCyprusCzech RepublicDenmarkDjiboutiDominicaDominican RepublicEarly-demographic dividendEast Asia & PacificEast Asia & Pacific (excluding high income)East Asia & Pacific (IDA & IBRD countries)EcuadorEgypt, Arab Rep.El SalvadorEquatorial GuineaEritreaEstoniaEthiopiaEuro areaEurope & Central AsiaEurope & Central Asia (excluding high income)Europe & Central Asia (IDA & IBRD countries)European UnionFijiFinlandFragile and conflict affected situationsFranceFrench PolynesiaGabonGambia, TheGeorgiaGermanyGhanaGreeceGreenlandGrenadaGuatemalaGuineaGuinea-BissauGuyanaHaitiHeavily indebted poor countries (HIPC)High incomeHondurasHong Kong SAR, ChinaHungaryIBRD onlyIcelandIDA & IBRD totalIDA blendIDA onlyIDA totalIndiaIndonesiaIran, Islamic Rep.IraqIrelandIsle of ManIsraelItalyJamaicaJapanJordanKazakhstanKenyaKiribatiKorea, Rep.KosovoKuwaitKyrgyz RepublicLao PDRLate-demographic dividendLatin America & Caribbean Latin America & Caribbean (excluding high income)Latin America & the Caribbean (IDA & IBRD countries)LatviaLeast developed countries: UN classificationLebanonLesothoLiberiaLibyaLiechtensteinLithuaniaLow & middle incomeLow incomeLower middle incomeLuxembourgMacao SAR, ChinaMacedonia, FYRMadagascarMalawiMalaysiaMaldivesMaliMaltaMarshall IslandsMauritaniaMauritiusMexicoMicronesia, Fed. Sts.Middle East & North AfricaMiddle East & North Africa (excluding high income)Middle East & North Africa (IDA & IBRD countries)Middle incomeMoldovaMonacoMongoliaMontenegroMoroccoMozambiqueMyanmarNamibiaNauruNepalNetherlandsNew CaledoniaNew ZealandNicaraguaNigerNigeriaNorth AmericaNorwayOECD membersOmanOther small statesPacific island small statesPakistanPalauPanamaPapua New GuineaParaguayPeruPhilippinesPolandPortugalPost-demographic dividendPre-demographic dividendPuerto RicoQatarRomaniaRussian FederationRwandaSamoaSan MarinoSao Tome and PrincipeSaudi ArabiaSenegalSerbiaSeychellesSierra LeoneSingaporeSlovak RepublicSloveniaSmall statesSolomon IslandsSomaliaSouth AfricaSouth AsiaSouth Asia (IDA & IBRD)South SudanSpainSri LankaSt. Kitts and NevisSt. LuciaSt. Vincent and the GrenadinesSub-Saharan Africa Sub-Saharan Africa (excluding high income)Sub-Saharan Africa (IDA & IBRD countries)SudanSurinameSwazilandSwedenSwitzerlandSyrian Arab RepublicTajikistanTanzaniaThailandTimor-LesteTogoTongaTrinidad and TobagoTunisiaTurkeyTurkmenistanTuvaluUgandaUkraineUnited Arab EmiratesUnited KingdomUnited StatesUpper middle incomeUruguayUzbekistanVanuatuVenezuela, RBVietnamVirgin Islands (U.S.)West Bank and GazaWorldYemen, Rep.ZambiaZimbabwe Timeline:
This timeline shows a graph from 1962 to 2016 of Indonesia. No data until 1961. Number of actual observations by date: 55.
Source name:
World Development Indicators
Source organization:
World Bank national accounts data, and OECD National Accounts data files.
Categories, topics:
Economy & Growth
Last updated:
apr 23, 2017
Indicators value changes by year
Minimum:
-14.351
jan 1, 1999
At the date of observation
Value
Absolute change
Change from previous value
jan 1, 1962
3.344
+3.344
0.0%
jan 1, 1963
-0.755
-4.098
-122.57%
jan 1, 1964
-4.821
-4.067
538.94%
jan 1, 1965
0.715
+5.537
-114.84%
jan 1, 1966
-1.741
-2.456
-343.35%
jan 1, 1967
0.098
+1.839
-105.62%
jan 1, 1968
-1.587
-1.685
-1.72K%
jan 1, 1969
9.034
+10.621
-669.32%
jan 1, 1970
4.614
-4.42
-48.93%
jan 1, 1971
5.294
+0.68
14.74%
jan 1, 1972
4.196
-1.098
-20.74%
jan 1, 1973
5.087
+0.891
21.22%
jan 1, 1974
6.964
+1.877
36.91%
jan 1, 1975
5.52
-1.444
-20.74%
jan 1, 1976
3.536
-1.983
-35.93%
jan 1, 1977
3.389
-0.148
-4.17%
jan 1, 1978
6.017
+2.628
77.55%
jan 1, 1979
6.61
+0.593
9.85%
jan 1, 1980
4.574
-2.035
-30.8%
jan 1, 1981
6.191
+1.617
35.36%
jan 1, 1982
5.649
-0.542
-8.76%
jan 1, 1983
-1.204
-6.854
-121.32%
jan 1, 1984
6.022
+7.226
-600.11%
jan 1, 1985
4.843
-1.179
-19.58%
jan 1, 1986
1.31
-3.533
-72.95%
jan 1, 1987
3.832
+2.522
192.5%
jan 1, 1988
3.26
-0.571
-14.92%
jan 1, 1989
4.367
+1.107
33.96%
jan 1, 1990
7.106
+2.739
62.73%
jan 1, 1991
7.077
-0.029
-0.41%
jan 1, 1992
7.053
-0.024
-0.34%
jan 1, 1993
5.423
-1.63
-23.1%
jan 1, 1994
5.506
+0.083
1.52%
jan 1, 1995
5.84
+0.334
6.06%
jan 1, 1996
6.735
+0.896
15.34%
jan 1, 1997
6.044
-0.691
-10.26%
jan 1, 1998
3.189
-2.855
-47.24%
jan 1, 1999
-14.351
-17.54
-550.01%
jan 1, 2000
-0.605
+13.746
-95.78%
jan 1, 2001
3.484
+4.089
-675.56%
jan 1, 2002
2.238
-1.245
-35.75%
jan 1, 2003
3.095
+0.857
38.3%
jan 1, 2004
3.383
+0.287
9.28%
jan 1, 2005
3.638
+0.255
7.55%
jan 1, 2006
4.298
+0.66
18.13%
jan 1, 2007
4.116
-0.181
-4.22%
jan 1, 2008
4.957
+0.84
20.42%
jan 1, 2009
4.634
-0.323
-6.52%
jan 1, 2010
3.267
-1.367
-29.5%
jan 1, 2011
4.84
+1.573
48.15%
jan 1, 2012
4.784
-0.056
-1.15%
jan 1, 2013
4.649
-0.135
-2.81%
jan 1, 2014
4.2
-0.449
-9.66%
jan 1, 2015
3.709
-0.491
-11.7%
jan 1, 2016
3.529
-0.18
-4.85%
Ranking of countries by current statistics by years


Comments: