29
/
en
AIzaSyAYiBZKx7MnpbEhh9jyipgxe19OcubqV5w
April 1, 2024
265774
Tonga
TON
true
2
1
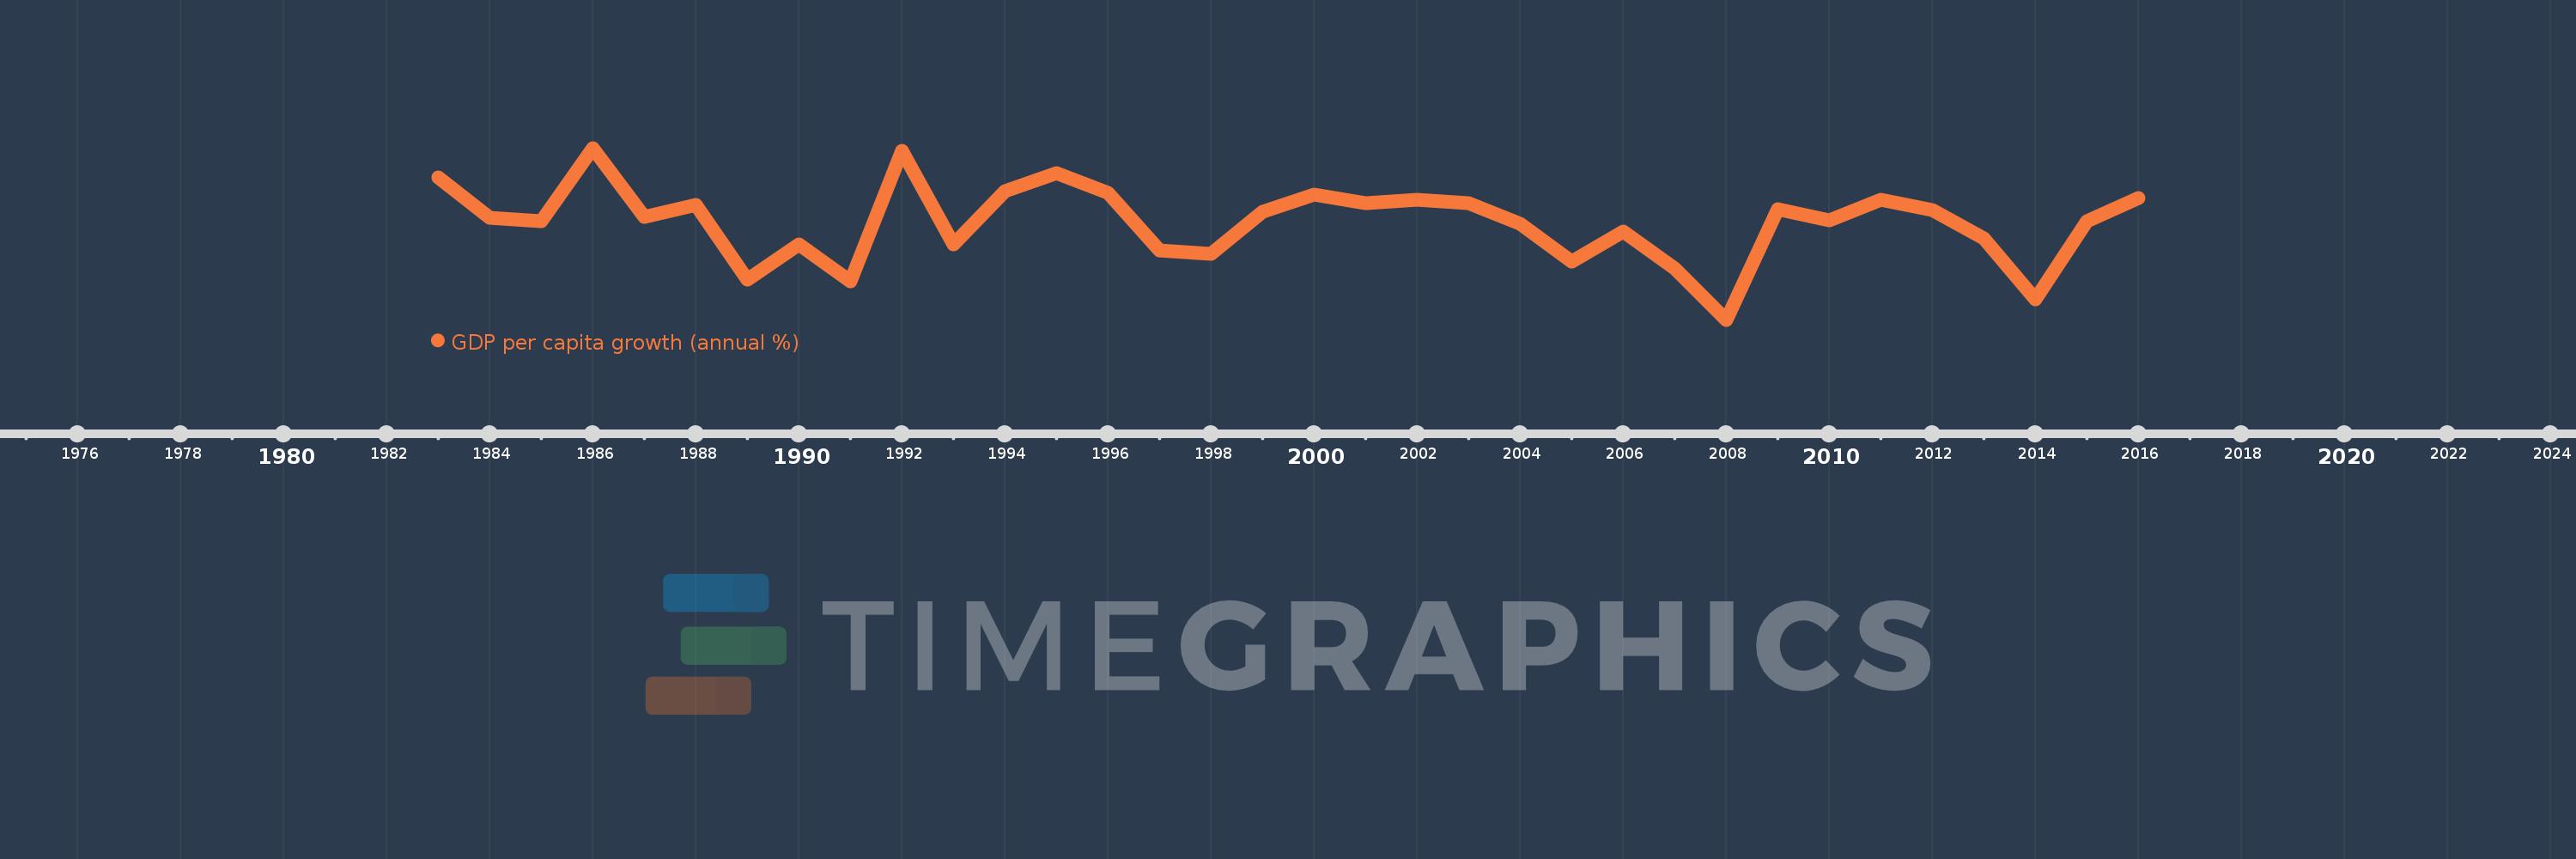
GDP per capita growth (annual %)
2016,2015,2014,2013,2012,2011,2010,2009,2008,2007,2006,2005,2004,2003,2002,2001,2000,1999,1998,1997,1996,1995,1994,1993,1992,1991,1990,1989,1988,1987,1986,1985,1984,1983
This statistics in other country:
AfghanistanAlbaniaAlgeriaAndorraAngolaAntigua and BarbudaArab WorldArgentinaArmeniaArubaAustraliaAustriaAzerbaijanBahamas, TheBahrainBangladeshBarbadosBelarusBelgiumBelizeBeninBermudaBhutanBoliviaBosnia and HerzegovinaBotswanaBrazilBrunei DarussalamBulgariaBurkina FasoBurundiCabo VerdeCambodiaCameroonCanadaCaribbean small statesCayman IslandsCentral African RepublicCentral Europe and the BalticsChadChannel IslandsChileChinaColombiaComorosCongo, Dem. Rep.Congo, Rep.Costa RicaCote d'IvoireCroatiaCubaCyprusCzech RepublicDenmarkDjiboutiDominicaDominican RepublicEarly-demographic dividendEast Asia & PacificEast Asia & Pacific (excluding high income)East Asia & Pacific (IDA & IBRD countries)EcuadorEgypt, Arab Rep.El SalvadorEquatorial GuineaEritreaEstoniaEthiopiaEuro areaEurope & Central AsiaEurope & Central Asia (excluding high income)Europe & Central Asia (IDA & IBRD countries)European UnionFijiFinlandFragile and conflict affected situationsFranceFrench PolynesiaGabonGambia, TheGeorgiaGermanyGhanaGreeceGreenlandGrenadaGuatemalaGuineaGuinea-BissauGuyanaHaitiHeavily indebted poor countries (HIPC)High incomeHondurasHong Kong SAR, ChinaHungaryIBRD onlyIcelandIDA & IBRD totalIDA blendIDA onlyIDA totalIndiaIndonesiaIran, Islamic Rep.IraqIrelandIsle of ManIsraelItalyJamaicaJapanJordanKazakhstanKenyaKiribatiKorea, Rep.KosovoKuwaitKyrgyz RepublicLao PDRLate-demographic dividendLatin America & Caribbean Latin America & Caribbean (excluding high income)Latin America & the Caribbean (IDA & IBRD countries)LatviaLeast developed countries: UN classificationLebanonLesothoLiberiaLibyaLiechtensteinLithuaniaLow & middle incomeLow incomeLower middle incomeLuxembourgMacao SAR, ChinaMacedonia, FYRMadagascarMalawiMalaysiaMaldivesMaliMaltaMarshall IslandsMauritaniaMauritiusMexicoMicronesia, Fed. Sts.Middle East & North AfricaMiddle East & North Africa (excluding high income)Middle East & North Africa (IDA & IBRD countries)Middle incomeMoldovaMonacoMongoliaMontenegroMoroccoMozambiqueMyanmarNamibiaNauruNepalNetherlandsNew CaledoniaNew ZealandNicaraguaNigerNigeriaNorth AmericaNorwayOECD membersOmanOther small statesPacific island small statesPakistanPalauPanamaPapua New GuineaParaguayPeruPhilippinesPolandPortugalPost-demographic dividendPre-demographic dividendPuerto RicoQatarRomaniaRussian FederationRwandaSamoaSan MarinoSao Tome and PrincipeSaudi ArabiaSenegalSerbiaSeychellesSierra LeoneSingaporeSlovak RepublicSloveniaSmall statesSolomon IslandsSomaliaSouth AfricaSouth AsiaSouth Asia (IDA & IBRD)South SudanSpainSri LankaSt. Kitts and NevisSt. LuciaSt. Vincent and the GrenadinesSub-Saharan Africa Sub-Saharan Africa (excluding high income)Sub-Saharan Africa (IDA & IBRD countries)SudanSurinameSwazilandSwedenSwitzerlandSyrian Arab RepublicTajikistanTanzaniaThailandTimor-LesteTogoTongaTrinidad and TobagoTunisiaTurkeyTurkmenistanTuvaluUgandaUkraineUnited Arab EmiratesUnited KingdomUnited StatesUpper middle incomeUruguayUzbekistanVanuatuVenezuela, RBVietnamVirgin Islands (U.S.)West Bank and GazaWorldYemen, Rep.ZambiaZimbabwe Timeline:
This timeline shows a graph from 1983 to 2016 of Tonga. No data until 1982. Number of actual observations by date: 34.
Source name:
World Development Indicators
Source organization:
World Bank national accounts data, and OECD National Accounts data files.
Categories, topics:
Economy & Growth
Last updated:
apr 23, 2017
Indicators value changes by year
Minimum:
-4.787
jan 1, 2008
At the date of observation
Value
Absolute change
Change from previous value
jan 1, 1983
4.483
+4.483
0.0%
jan 1, 1984
1.882
-2.601
-58.01%
jan 1, 1985
1.67
-0.212
-11.28%
jan 1, 1986
6.428
+4.758
284.89%
jan 1, 1987
1.908
-4.52
-70.31%
jan 1, 1988
2.711
+0.802
42.05%
jan 1, 1989
-2.173
-4.884
-180.17%
jan 1, 1990
0.112
+2.285
-105.15%
jan 1, 1991
-2.259
-2.371
-2.12K%
jan 1, 1992
6.245
+8.504
-376.43%
jan 1, 1993
0.129
-6.116
-97.93%
jan 1, 1994
3.618
+3.488
2.7K%
jan 1, 1995
4.792
+1.175
32.48%
jan 1, 1996
3.484
-1.309
-27.31%
jan 1, 1997
-0.286
-3.77
-108.21%
jan 1, 1998
-0.496
-0.21
73.25%
jan 1, 1999
2.283
+2.779
-560.55%
jan 1, 2000
3.39
+1.107
48.47%
jan 1, 2001
2.842
-0.548
-16.17%
jan 1, 2002
3.038
+0.196
6.89%
jan 1, 2003
2.822
-0.215
-7.09%
jan 1, 2004
1.492
-1.33
-47.12%
jan 1, 2005
-0.968
-2.46
-164.85%
jan 1, 2006
0.946
+1.913
-197.7%
jan 1, 2007
-1.446
-2.392
-252.96%
jan 1, 2008
-4.787
-3.34
230.94%
jan 1, 2009
2.446
+7.233
-151.1%
jan 1, 2010
1.706
-0.74
-30.24%
jan 1, 2011
3.046
+1.34
78.51%
jan 1, 2012
2.354
-0.692
-22.71%
jan 1, 2013
0.526
-1.828
-77.64%
jan 1, 2014
-3.467
-3.993
-758.64%
jan 1, 2015
1.633
+5.1
-147.09%
jan 1, 2016
3.136
+1.503
92.07%
Ranking of countries by current statistics by years


Comments: