29
/
en
AIzaSyAYiBZKx7MnpbEhh9jyipgxe19OcubqV5w
April 1, 2024
195551
Mexico
MEX
true
2
1
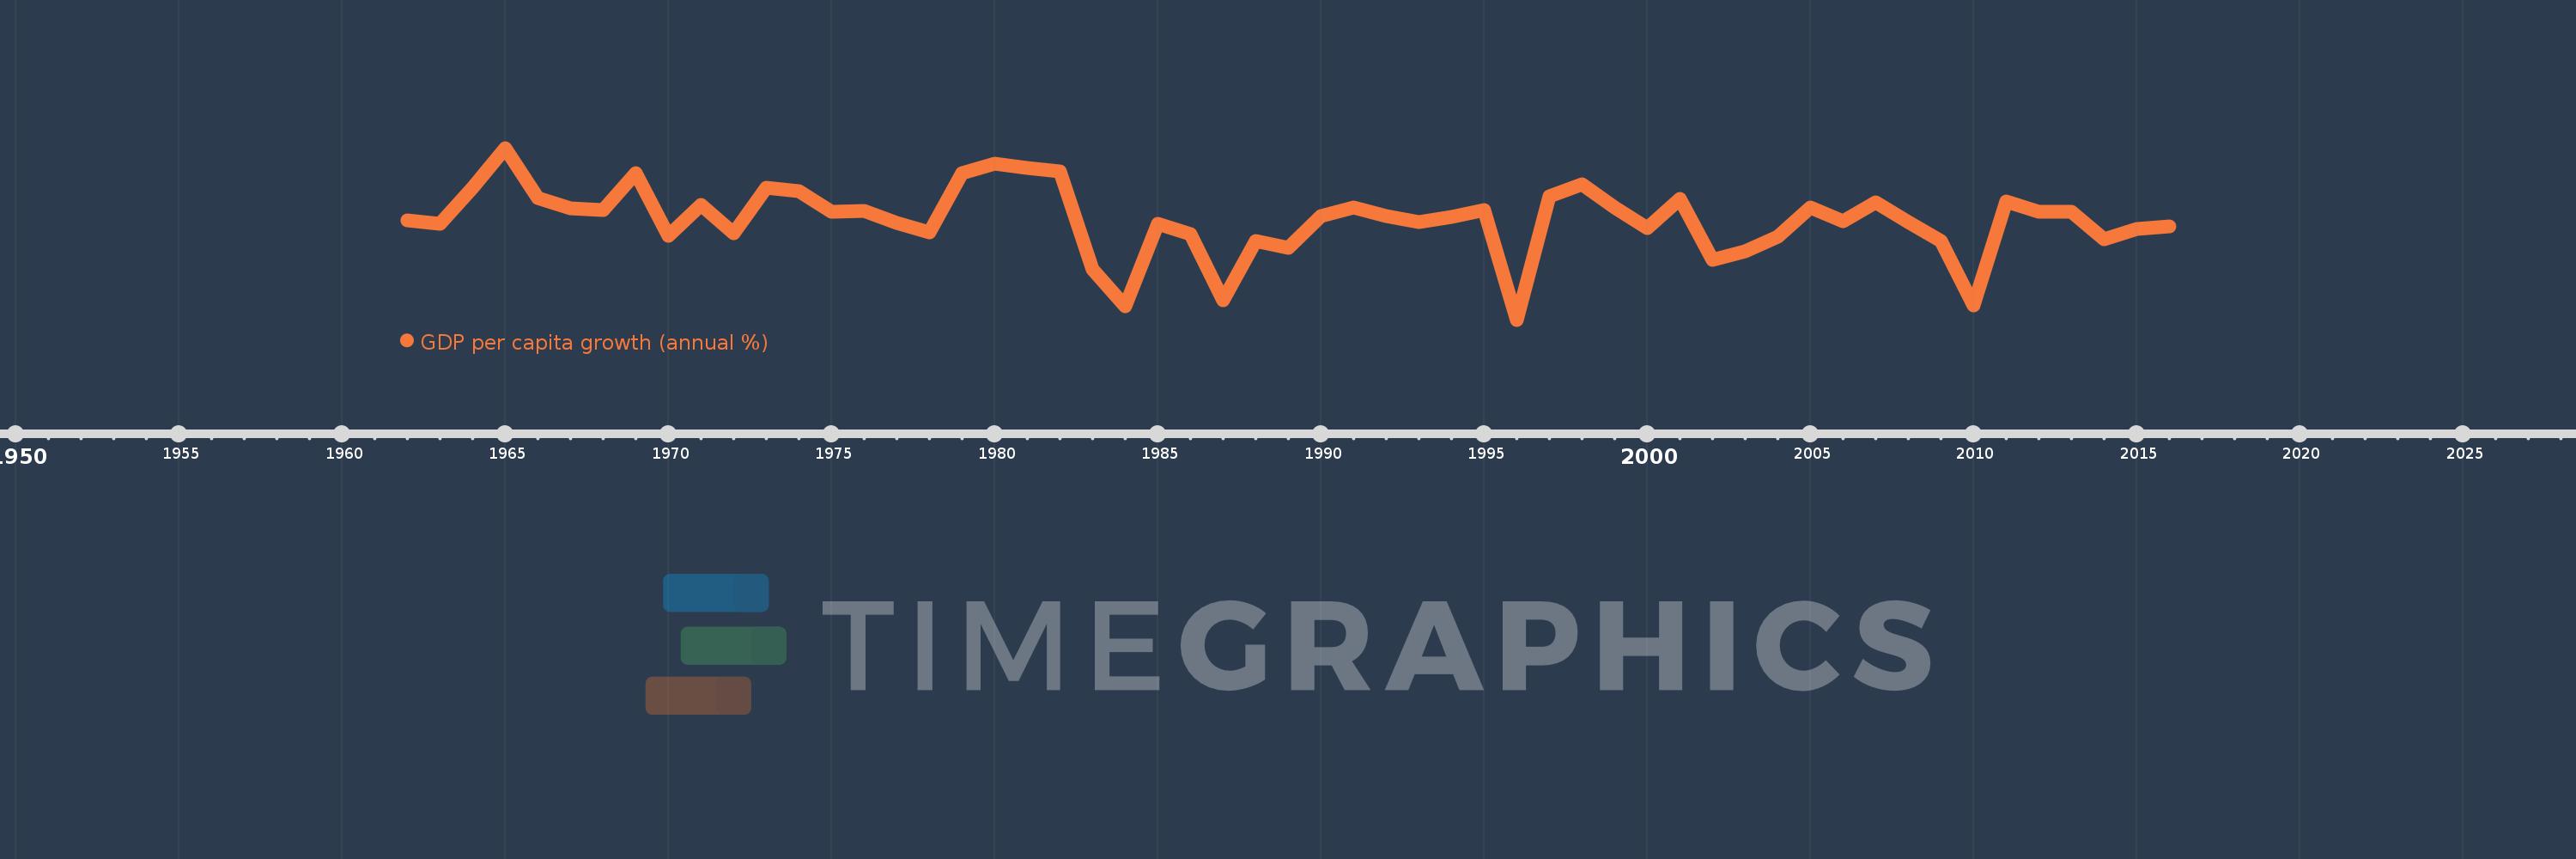
GDP per capita growth (annual %)
2016,2015,2014,2013,2012,2011,2010,2009,2008,2007,2006,2005,2004,2003,2002,2001,2000,1999,1998,1997,1996,1995,1994,1993,1992,1991,1990,1989,1988,1987,1986,1985,1984,1983,1982,1981,1980,1979,1978,1977,1976,1975,1974,1973,1972,1971,1970,1969,1968,1967,1966,1965,1964,1963,1962
This statistics in other country:
AfghanistanAlbaniaAlgeriaAndorraAngolaAntigua and BarbudaArab WorldArgentinaArmeniaArubaAustraliaAustriaAzerbaijanBahamas, TheBahrainBangladeshBarbadosBelarusBelgiumBelizeBeninBermudaBhutanBoliviaBosnia and HerzegovinaBotswanaBrazilBrunei DarussalamBulgariaBurkina FasoBurundiCabo VerdeCambodiaCameroonCanadaCaribbean small statesCayman IslandsCentral African RepublicCentral Europe and the BalticsChadChannel IslandsChileChinaColombiaComorosCongo, Dem. Rep.Congo, Rep.Costa RicaCote d'IvoireCroatiaCubaCyprusCzech RepublicDenmarkDjiboutiDominicaDominican RepublicEarly-demographic dividendEast Asia & PacificEast Asia & Pacific (excluding high income)East Asia & Pacific (IDA & IBRD countries)EcuadorEgypt, Arab Rep.El SalvadorEquatorial GuineaEritreaEstoniaEthiopiaEuro areaEurope & Central AsiaEurope & Central Asia (excluding high income)Europe & Central Asia (IDA & IBRD countries)European UnionFijiFinlandFragile and conflict affected situationsFranceFrench PolynesiaGabonGambia, TheGeorgiaGermanyGhanaGreeceGreenlandGrenadaGuatemalaGuineaGuinea-BissauGuyanaHaitiHeavily indebted poor countries (HIPC)High incomeHondurasHong Kong SAR, ChinaHungaryIBRD onlyIcelandIDA & IBRD totalIDA blendIDA onlyIDA totalIndiaIndonesiaIran, Islamic Rep.IraqIrelandIsle of ManIsraelItalyJamaicaJapanJordanKazakhstanKenyaKiribatiKorea, Rep.KosovoKuwaitKyrgyz RepublicLao PDRLate-demographic dividendLatin America & Caribbean Latin America & Caribbean (excluding high income)Latin America & the Caribbean (IDA & IBRD countries)LatviaLeast developed countries: UN classificationLebanonLesothoLiberiaLibyaLiechtensteinLithuaniaLow & middle incomeLow incomeLower middle incomeLuxembourgMacao SAR, ChinaMacedonia, FYRMadagascarMalawiMalaysiaMaldivesMaliMaltaMarshall IslandsMauritaniaMauritiusMexicoMicronesia, Fed. Sts.Middle East & North AfricaMiddle East & North Africa (excluding high income)Middle East & North Africa (IDA & IBRD countries)Middle incomeMoldovaMonacoMongoliaMontenegroMoroccoMozambiqueMyanmarNamibiaNauruNepalNetherlandsNew CaledoniaNew ZealandNicaraguaNigerNigeriaNorth AmericaNorwayOECD membersOmanOther small statesPacific island small statesPakistanPalauPanamaPapua New GuineaParaguayPeruPhilippinesPolandPortugalPost-demographic dividendPre-demographic dividendPuerto RicoQatarRomaniaRussian FederationRwandaSamoaSan MarinoSao Tome and PrincipeSaudi ArabiaSenegalSerbiaSeychellesSierra LeoneSingaporeSlovak RepublicSloveniaSmall statesSolomon IslandsSomaliaSouth AfricaSouth AsiaSouth Asia (IDA & IBRD)South SudanSpainSri LankaSt. Kitts and NevisSt. LuciaSt. Vincent and the GrenadinesSub-Saharan Africa Sub-Saharan Africa (excluding high income)Sub-Saharan Africa (IDA & IBRD countries)SudanSurinameSwazilandSwedenSwitzerlandSyrian Arab RepublicTajikistanTanzaniaThailandTimor-LesteTogoTongaTrinidad and TobagoTunisiaTurkeyTurkmenistanTuvaluUgandaUkraineUnited Arab EmiratesUnited KingdomUnited StatesUpper middle incomeUruguayUzbekistanVanuatuVenezuela, RBVietnamVirgin Islands (U.S.)West Bank and GazaWorldYemen, Rep.ZambiaZimbabwe Timeline:
This timeline shows a graph from 1962 to 2016 of Mexico. No data until 1961. Number of actual observations by date: 55.
Source name:
World Development Indicators
Source organization:
World Bank national accounts data, and OECD National Accounts data files.
Categories, topics:
Economy & Growth
Last updated:
apr 23, 2017
Indicators value changes by year
Minimum:
-7.518
jan 1, 1996
At the date of observation
Value
Absolute change
Change from previous value
jan 1, 1962
1.748
+1.748
0.0%
jan 1, 1963
1.432
-0.316
-18.1%
jan 1, 1964
4.781
+3.349
233.9%
jan 1, 1965
8.48
+3.699
77.37%
jan 1, 1966
3.839
-4.641
-54.73%
jan 1, 1967
2.896
-0.943
-24.57%
jan 1, 1968
2.689
-0.207
-7.14%
jan 1, 1969
6.147
+3.458
128.6%
jan 1, 1970
0.282
-5.865
-95.42%
jan 1, 1971
3.214
+2.932
1.04K%
jan 1, 1972
0.499
-2.715
-84.48%
jan 1, 1973
4.794
+4.296
861.3%
jan 1, 1974
4.466
-0.329
-6.85%
jan 1, 1975
2.542
-1.924
-43.08%
jan 1, 1976
2.649
+0.107
4.21%
jan 1, 1977
1.503
-1.146
-43.25%
jan 1, 1978
0.63
-0.873
-58.06%
jan 1, 1979
6.172
+5.541
878.91%
jan 1, 1980
7.003
+0.832
13.48%
jan 1, 1981
6.646
-0.358
-5.11%
jan 1, 1982
6.289
-0.356
-5.36%
jan 1, 1983
-2.816
-9.105
-144.77%
jan 1, 1984
-6.245
-3.429
121.79%
jan 1, 1985
1.438
+7.683
-123.02%
jan 1, 1986
0.469
-0.969
-67.4%
jan 1, 1987
-5.725
-6.194
-1.32K%
jan 1, 1988
-0.207
+5.518
-96.39%
jan 1, 1989
-0.789
-0.582
281.26%
jan 1, 1990
2.114
+2.903
-367.95%
jan 1, 1991
2.972
+0.859
40.62%
jan 1, 1992
2.149
-0.824
-27.71%
jan 1, 1993
1.579
-0.57
-26.53%
jan 1, 1994
2.027
+0.448
28.39%
jan 1, 1995
2.72
+0.693
34.18%
jan 1, 1996
-7.518
-10.238
-376.47%
jan 1, 1997
3.943
+11.462
-152.45%
jan 1, 1998
5.058
+1.115
28.27%
jan 1, 1999
2.909
-2.149
-42.49%
jan 1, 2000
1.01
-1.898
-65.27%
jan 1, 2001
3.717
+2.707
267.98%
jan 1, 2002
-1.97
-5.687
-153.0%
jan 1, 2003
-1.138
+0.832
-42.24%
jan 1, 2004
0.18
+1.317
-115.78%
jan 1, 2005
2.976
+2.797
1.56K%
jan 1, 2006
1.634
-1.343
-45.11%
jan 1, 2007
3.404
+1.77
108.37%
jan 1, 2008
1.602
-1.802
-52.94%
jan 1, 2009
-0.217
-1.819
-113.53%
jan 1, 2010
-6.204
-5.987
2.76K%
jan 1, 2011
3.513
+9.717
-156.63%
jan 1, 2012
2.534
-0.98
-27.88%
jan 1, 2013
2.565
+0.031
1.22%
jan 1, 2014
-0.007
-2.572
-100.28%
jan 1, 2015
0.903
+0.91
-12.68K%
jan 1, 2016
1.149
+0.246
27.19%
Ranking of countries by current statistics by years


Comments: