29
/
en
AIzaSyAYiBZKx7MnpbEhh9jyipgxe19OcubqV5w
April 1, 2024
41452
Latin America & Caribbean
LCN
false
2
1
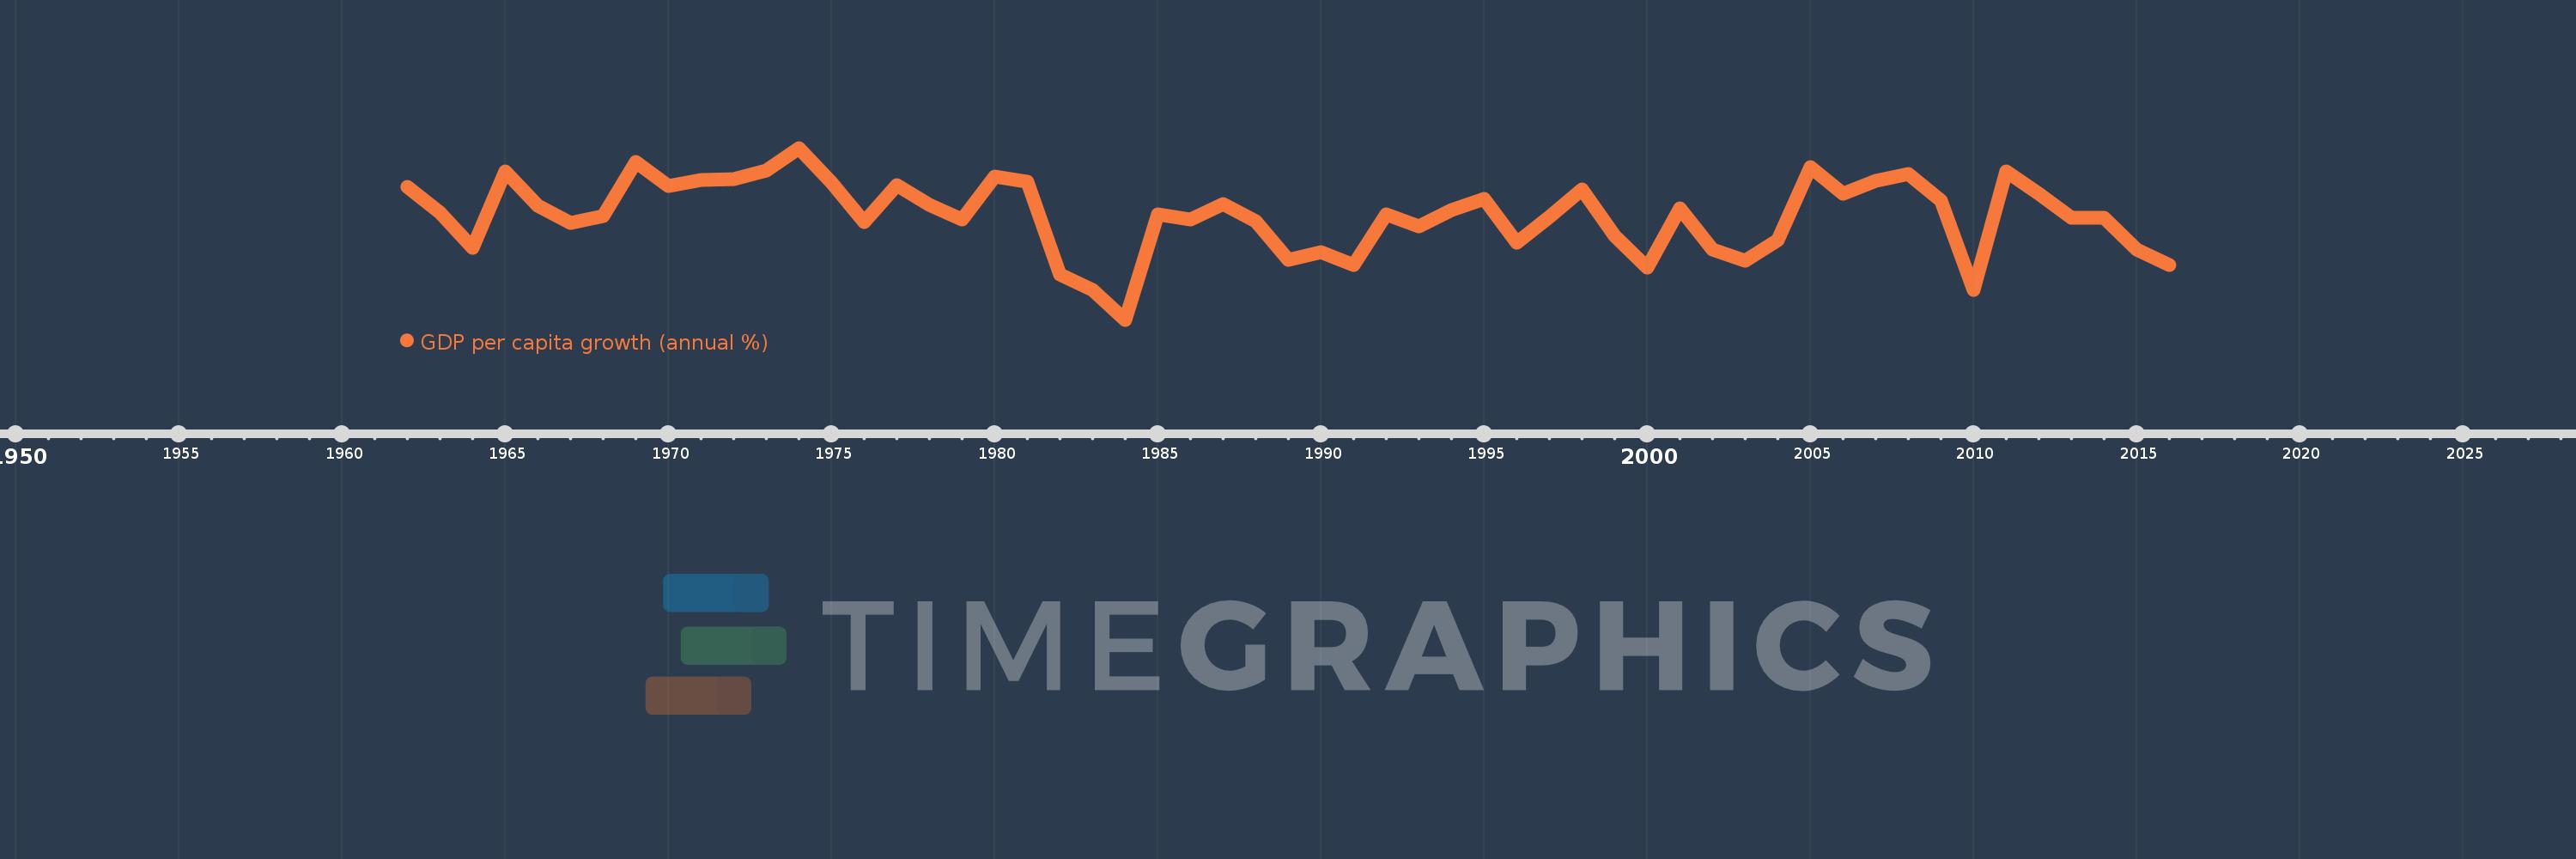
GDP per capita growth (annual %)
2016,2015,2014,2013,2012,2011,2010,2009,2008,2007,2006,2005,2004,2003,2002,2001,2000,1999,1998,1997,1996,1995,1994,1993,1992,1991,1990,1989,1988,1987,1986,1985,1984,1983,1982,1981,1980,1979,1978,1977,1976,1975,1974,1973,1972,1971,1970,1969,1968,1967,1966,1965,1964,1963,1962
This statistics in other country:
AfghanistanAlbaniaAlgeriaAndorraAngolaAntigua and BarbudaArab WorldArgentinaArmeniaArubaAustraliaAustriaAzerbaijanBahamas, TheBahrainBangladeshBarbadosBelarusBelgiumBelizeBeninBermudaBhutanBoliviaBosnia and HerzegovinaBotswanaBrazilBrunei DarussalamBulgariaBurkina FasoBurundiCabo VerdeCambodiaCameroonCanadaCaribbean small statesCayman IslandsCentral African RepublicCentral Europe and the BalticsChadChannel IslandsChileChinaColombiaComorosCongo, Dem. Rep.Congo, Rep.Costa RicaCote d'IvoireCroatiaCubaCyprusCzech RepublicDenmarkDjiboutiDominicaDominican RepublicEarly-demographic dividendEast Asia & PacificEast Asia & Pacific (excluding high income)East Asia & Pacific (IDA & IBRD countries)EcuadorEgypt, Arab Rep.El SalvadorEquatorial GuineaEritreaEstoniaEthiopiaEuro areaEurope & Central AsiaEurope & Central Asia (excluding high income)Europe & Central Asia (IDA & IBRD countries)European UnionFijiFinlandFragile and conflict affected situationsFranceFrench PolynesiaGabonGambia, TheGeorgiaGermanyGhanaGreeceGreenlandGrenadaGuatemalaGuineaGuinea-BissauGuyanaHaitiHeavily indebted poor countries (HIPC)High incomeHondurasHong Kong SAR, ChinaHungaryIBRD onlyIcelandIDA & IBRD totalIDA blendIDA onlyIDA totalIndiaIndonesiaIran, Islamic Rep.IraqIrelandIsle of ManIsraelItalyJamaicaJapanJordanKazakhstanKenyaKiribatiKorea, Rep.KosovoKuwaitKyrgyz RepublicLao PDRLate-demographic dividendLatin America & Caribbean Latin America & Caribbean (excluding high income)Latin America & the Caribbean (IDA & IBRD countries)LatviaLeast developed countries: UN classificationLebanonLesothoLiberiaLibyaLiechtensteinLithuaniaLow & middle incomeLow incomeLower middle incomeLuxembourgMacao SAR, ChinaMacedonia, FYRMadagascarMalawiMalaysiaMaldivesMaliMaltaMarshall IslandsMauritaniaMauritiusMexicoMicronesia, Fed. Sts.Middle East & North AfricaMiddle East & North Africa (excluding high income)Middle East & North Africa (IDA & IBRD countries)Middle incomeMoldovaMonacoMongoliaMontenegroMoroccoMozambiqueMyanmarNamibiaNauruNepalNetherlandsNew CaledoniaNew ZealandNicaraguaNigerNigeriaNorth AmericaNorwayOECD membersOmanOther small statesPacific island small statesPakistanPalauPanamaPapua New GuineaParaguayPeruPhilippinesPolandPortugalPost-demographic dividendPre-demographic dividendPuerto RicoQatarRomaniaRussian FederationRwandaSamoaSan MarinoSao Tome and PrincipeSaudi ArabiaSenegalSerbiaSeychellesSierra LeoneSingaporeSlovak RepublicSloveniaSmall statesSolomon IslandsSomaliaSouth AfricaSouth AsiaSouth Asia (IDA & IBRD)South SudanSpainSri LankaSt. Kitts and NevisSt. LuciaSt. Vincent and the GrenadinesSub-Saharan Africa Sub-Saharan Africa (excluding high income)Sub-Saharan Africa (IDA & IBRD countries)SudanSurinameSwazilandSwedenSwitzerlandSyrian Arab RepublicTajikistanTanzaniaThailandTimor-LesteTogoTongaTrinidad and TobagoTunisiaTurkeyTurkmenistanTuvaluUgandaUkraineUnited Arab EmiratesUnited KingdomUnited StatesUpper middle incomeUruguayUzbekistanVanuatuVenezuela, RBVietnamVirgin Islands (U.S.)West Bank and GazaWorldYemen, Rep.ZambiaZimbabwe Timeline:
This timeline shows a graph from 1962 to 2016 of Latin America & Caribbean . No data until 1961. Number of actual observations by date: 55.
Source name:
World Development Indicators
Source organization:
World Bank national accounts data, and OECD National Accounts data files.
Categories, topics:
Economy & Growth
Last updated:
apr 23, 2017
Indicators value changes by year
Minimum:
-4.767
jan 1, 1984
At the date of observation
Value
Absolute change
Change from previous value
jan 1, 1962
3.602
+3.602
0.0%
jan 1, 1963
1.947
-1.654
-45.93%
jan 1, 1964
-0.264
-2.211
-113.55%
jan 1, 1965
4.532
+4.795
-1.82K%
jan 1, 1966
2.38
-2.152
-47.49%
jan 1, 1967
1.33
-1.05
-44.12%
jan 1, 1968
1.736
+0.406
30.54%
jan 1, 1969
5.115
+3.379
194.68%
jan 1, 1970
3.645
-1.47
-28.73%
jan 1, 1971
4.013
+0.368
10.09%
jan 1, 1972
4.037
+0.023
0.58%
jan 1, 1973
4.579
+0.543
13.45%
jan 1, 1974
6.021
+1.441
31.47%
jan 1, 1975
3.852
-2.169
-36.03%
jan 1, 1976
1.345
-2.507
-65.08%
jan 1, 1977
3.705
+2.36
175.45%
jan 1, 1978
2.428
-1.277
-34.47%
jan 1, 1979
1.526
-0.902
-37.15%
jan 1, 1980
4.2
+2.674
175.23%
jan 1, 1981
3.9
-0.3
-7.14%
jan 1, 1982
-1.925
-5.825
-149.37%
jan 1, 1983
-2.907
-0.982
51.01%
jan 1, 1984
-4.767
-1.859
63.96%
jan 1, 1985
1.844
+6.61
-138.68%
jan 1, 1986
1.522
-0.321
-17.42%
jan 1, 1987
2.479
+0.956
62.81%
jan 1, 1988
1.419
-1.06
-42.77%
jan 1, 1989
-1.012
-2.43
-171.34%
jan 1, 1990
-0.525
+0.487
-48.09%
jan 1, 1991
-1.342
-0.817
155.46%
jan 1, 1992
1.852
+3.194
-238.0%
jan 1, 1993
1.095
-0.757
-40.88%
jan 1, 1994
2.136
+1.041
95.12%
jan 1, 1995
2.818
+0.681
31.89%
jan 1, 1996
0.054
-2.764
-98.1%
jan 1, 1997
1.694
+1.64
3.06K%
jan 1, 1998
3.403
+1.709
100.92%
jan 1, 1999
0.516
-2.887
-84.83%
jan 1, 2000
-1.5
-2.016
-390.6%
jan 1, 2001
2.244
+3.744
-249.6%
jan 1, 2002
-0.382
-2.626
-117.03%
jan 1, 2003
-1.044
-0.662
173.23%
jan 1, 2004
0.232
+1.276
-122.24%
jan 1, 2005
4.823
+4.591
1.98K%
jan 1, 2006
3.141
-1.683
-34.89%
jan 1, 2007
3.977
+0.837
26.64%
jan 1, 2008
4.392
+0.415
10.42%
jan 1, 2009
2.703
-1.688
-38.45%
jan 1, 2010
-2.913
-5.616
-207.75%
jan 1, 2011
4.544
+7.456
-255.99%
jan 1, 2012
3.171
-1.372
-30.2%
jan 1, 2013
1.661
-1.51
-47.62%
jan 1, 2014
1.642
-0.019
-1.17%
jan 1, 2015
-0.35
-1.991
-121.3%
jan 1, 2016
-1.346
-0.996
284.75%
Ranking of countries by current statistics by years


Comments: