29
/
en
AIzaSyAYiBZKx7MnpbEhh9jyipgxe19OcubqV5w
April 1, 2024
115796
Cuba
CUB
true
2
1
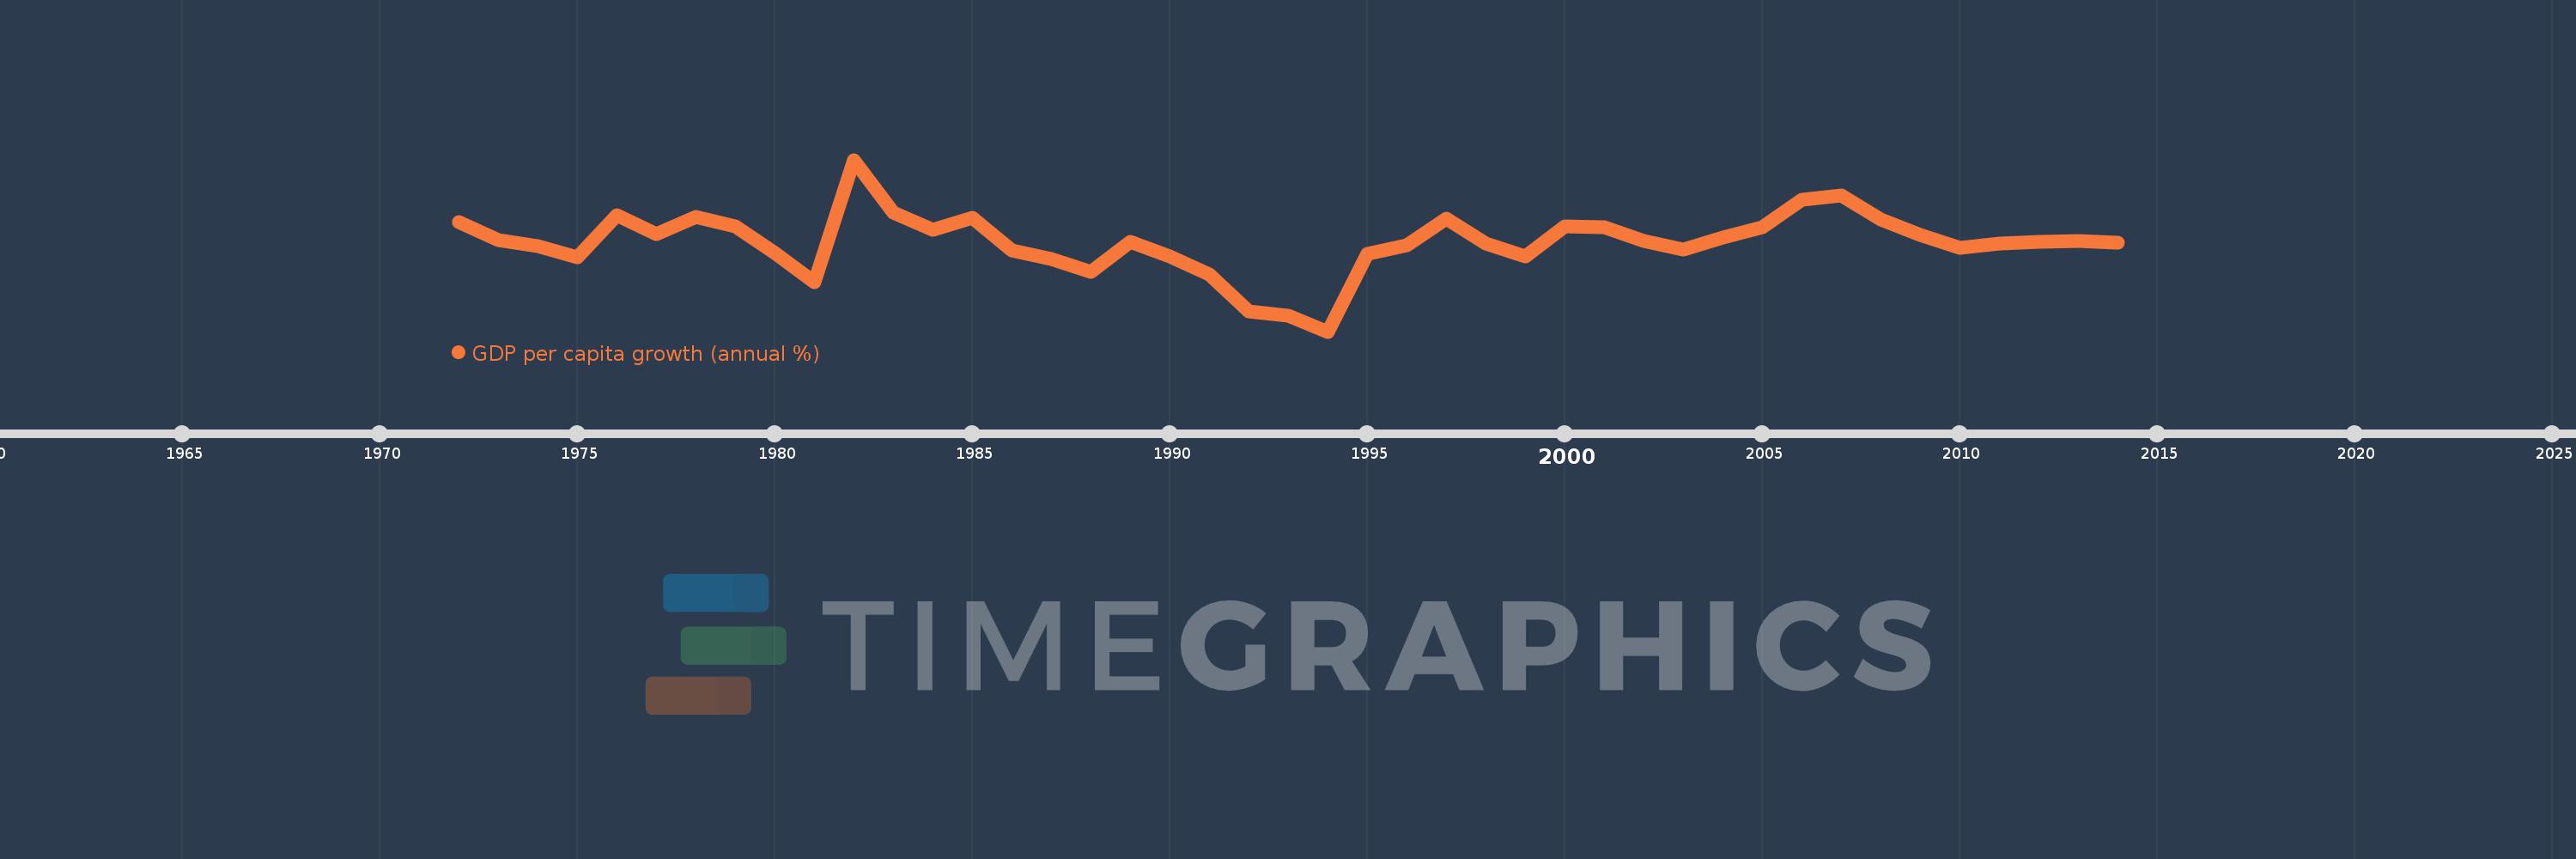
GDP per capita growth (annual %)
2014,2013,2012,2011,2010,2009,2008,2007,2006,2005,2004,2003,2002,2001,2000,1999,1998,1997,1996,1995,1994,1993,1992,1991,1990,1989,1988,1987,1986,1985,1984,1983,1982,1981,1980,1979,1978,1977,1976,1975,1974,1973,1972
This statistics in other country:
AfghanistanAlbaniaAlgeriaAndorraAngolaAntigua and BarbudaArab WorldArgentinaArmeniaArubaAustraliaAustriaAzerbaijanBahamas, TheBahrainBangladeshBarbadosBelarusBelgiumBelizeBeninBermudaBhutanBoliviaBosnia and HerzegovinaBotswanaBrazilBrunei DarussalamBulgariaBurkina FasoBurundiCabo VerdeCambodiaCameroonCanadaCaribbean small statesCayman IslandsCentral African RepublicCentral Europe and the BalticsChadChannel IslandsChileChinaColombiaComorosCongo, Dem. Rep.Congo, Rep.Costa RicaCote d'IvoireCroatiaCubaCyprusCzech RepublicDenmarkDjiboutiDominicaDominican RepublicEarly-demographic dividendEast Asia & PacificEast Asia & Pacific (excluding high income)East Asia & Pacific (IDA & IBRD countries)EcuadorEgypt, Arab Rep.El SalvadorEquatorial GuineaEritreaEstoniaEthiopiaEuro areaEurope & Central AsiaEurope & Central Asia (excluding high income)Europe & Central Asia (IDA & IBRD countries)European UnionFijiFinlandFragile and conflict affected situationsFranceFrench PolynesiaGabonGambia, TheGeorgiaGermanyGhanaGreeceGreenlandGrenadaGuatemalaGuineaGuinea-BissauGuyanaHaitiHeavily indebted poor countries (HIPC)High incomeHondurasHong Kong SAR, ChinaHungaryIBRD onlyIcelandIDA & IBRD totalIDA blendIDA onlyIDA totalIndiaIndonesiaIran, Islamic Rep.IraqIrelandIsle of ManIsraelItalyJamaicaJapanJordanKazakhstanKenyaKiribatiKorea, Rep.KosovoKuwaitKyrgyz RepublicLao PDRLate-demographic dividendLatin America & Caribbean Latin America & Caribbean (excluding high income)Latin America & the Caribbean (IDA & IBRD countries)LatviaLeast developed countries: UN classificationLebanonLesothoLiberiaLibyaLiechtensteinLithuaniaLow & middle incomeLow incomeLower middle incomeLuxembourgMacao SAR, ChinaMacedonia, FYRMadagascarMalawiMalaysiaMaldivesMaliMaltaMarshall IslandsMauritaniaMauritiusMexicoMicronesia, Fed. Sts.Middle East & North AfricaMiddle East & North Africa (excluding high income)Middle East & North Africa (IDA & IBRD countries)Middle incomeMoldovaMonacoMongoliaMontenegroMoroccoMozambiqueMyanmarNamibiaNauruNepalNetherlandsNew CaledoniaNew ZealandNicaraguaNigerNigeriaNorth AmericaNorwayOECD membersOmanOther small statesPacific island small statesPakistanPalauPanamaPapua New GuineaParaguayPeruPhilippinesPolandPortugalPost-demographic dividendPre-demographic dividendPuerto RicoQatarRomaniaRussian FederationRwandaSamoaSan MarinoSao Tome and PrincipeSaudi ArabiaSenegalSerbiaSeychellesSierra LeoneSingaporeSlovak RepublicSloveniaSmall statesSolomon IslandsSomaliaSouth AfricaSouth AsiaSouth Asia (IDA & IBRD)South SudanSpainSri LankaSt. Kitts and NevisSt. LuciaSt. Vincent and the GrenadinesSub-Saharan Africa Sub-Saharan Africa (excluding high income)Sub-Saharan Africa (IDA & IBRD countries)SudanSurinameSwazilandSwedenSwitzerlandSyrian Arab RepublicTajikistanTanzaniaThailandTimor-LesteTogoTongaTrinidad and TobagoTunisiaTurkeyTurkmenistanTuvaluUgandaUkraineUnited Arab EmiratesUnited KingdomUnited StatesUpper middle incomeUruguayUzbekistanVanuatuVenezuela, RBVietnamVirgin Islands (U.S.)West Bank and GazaWorldYemen, Rep.ZambiaZimbabwe Timeline:
This timeline shows a graph from 1972 to 2014 of Cuba. No data until 1971. Number of actual observations by date: 43.
Source name:
World Development Indicators
Source organization:
World Bank national accounts data, and OECD National Accounts data files.
Categories, topics:
Economy & Growth
Last updated:
apr 23, 2017
Indicators value changes by year
Minimum:
-15.365
jan 1, 1994
Maximum:
19.094
jan 1, 1982
At the date of observation
Value
Absolute change
Change from previous value
jan 1, 1972
6.688
+6.688
0.0%
jan 1, 1973
3.022
-3.666
-54.81%
jan 1, 1974
1.735
-1.287
-42.59%
jan 1, 1975
-0.526
-2.261
-130.3%
jan 1, 1976
8.049
+8.575
-1.63K%
jan 1, 1977
4.259
-3.79
-47.09%
jan 1, 1978
7.689
+3.43
80.54%
jan 1, 1979
5.754
-1.935
-25.17%
jan 1, 1980
0.407
-5.347
-92.93%
jan 1, 1981
-5.41
-5.816
-1.43K%
jan 1, 1982
19.094
+24.504
-452.98%
jan 1, 1983
8.464
-10.631
-55.67%
jan 1, 1984
4.977
-3.487
-41.2%
jan 1, 1985
7.387
+2.411
48.44%
jan 1, 1986
0.932
-6.455
-87.38%
jan 1, 1987
-0.742
-1.674
-179.53%
jan 1, 1988
-3.365
-2.623
353.75%
jan 1, 1989
2.608
+5.973
-177.52%
jan 1, 1990
-0.348
-2.956
-113.32%
jan 1, 1991
-3.829
-3.481
1.0K%
jan 1, 1992
-11.384
-7.555
197.32%
jan 1, 1993
-12.167
-0.783
6.88%
jan 1, 1994
-15.365
-3.198
26.29%
jan 1, 1995
0.198
+15.564
-101.29%
jan 1, 1996
1.963
+1.765
889.44%
jan 1, 1997
7.353
+5.39
274.61%
jan 1, 1998
2.364
-4.989
-67.85%
jan 1, 1999
-0.22
-2.584
-109.32%
jan 1, 2000
5.821
+6.042
-2.74K%
jan 1, 2001
5.57
-0.251
-4.31%
jan 1, 2002
2.861
-2.709
-48.63%
jan 1, 2003
1.129
-1.733
-60.55%
jan 1, 2004
3.511
+2.382
211.06%
jan 1, 2005
5.528
+2.017
57.44%
jan 1, 2006
11.001
+5.473
99.01%
jan 1, 2007
11.925
+0.925
8.41%
jan 1, 2008
7.178
-4.747
-39.81%
jan 1, 2009
4.06
-3.118
-43.44%
jan 1, 2010
1.384
-2.675
-65.9%
jan 1, 2011
2.292
+0.907
65.52%
jan 1, 2012
2.663
+0.371
16.2%
jan 1, 2013
2.841
+0.178
6.7%
jan 1, 2014
2.506
-0.335
-11.79%
Ranking of countries by current statistics by years


Comments: