29
/
en
AIzaSyAYiBZKx7MnpbEhh9jyipgxe19OcubqV5w
April 1, 2024
30681
Europe & Central Asia
ECS
false
2
1
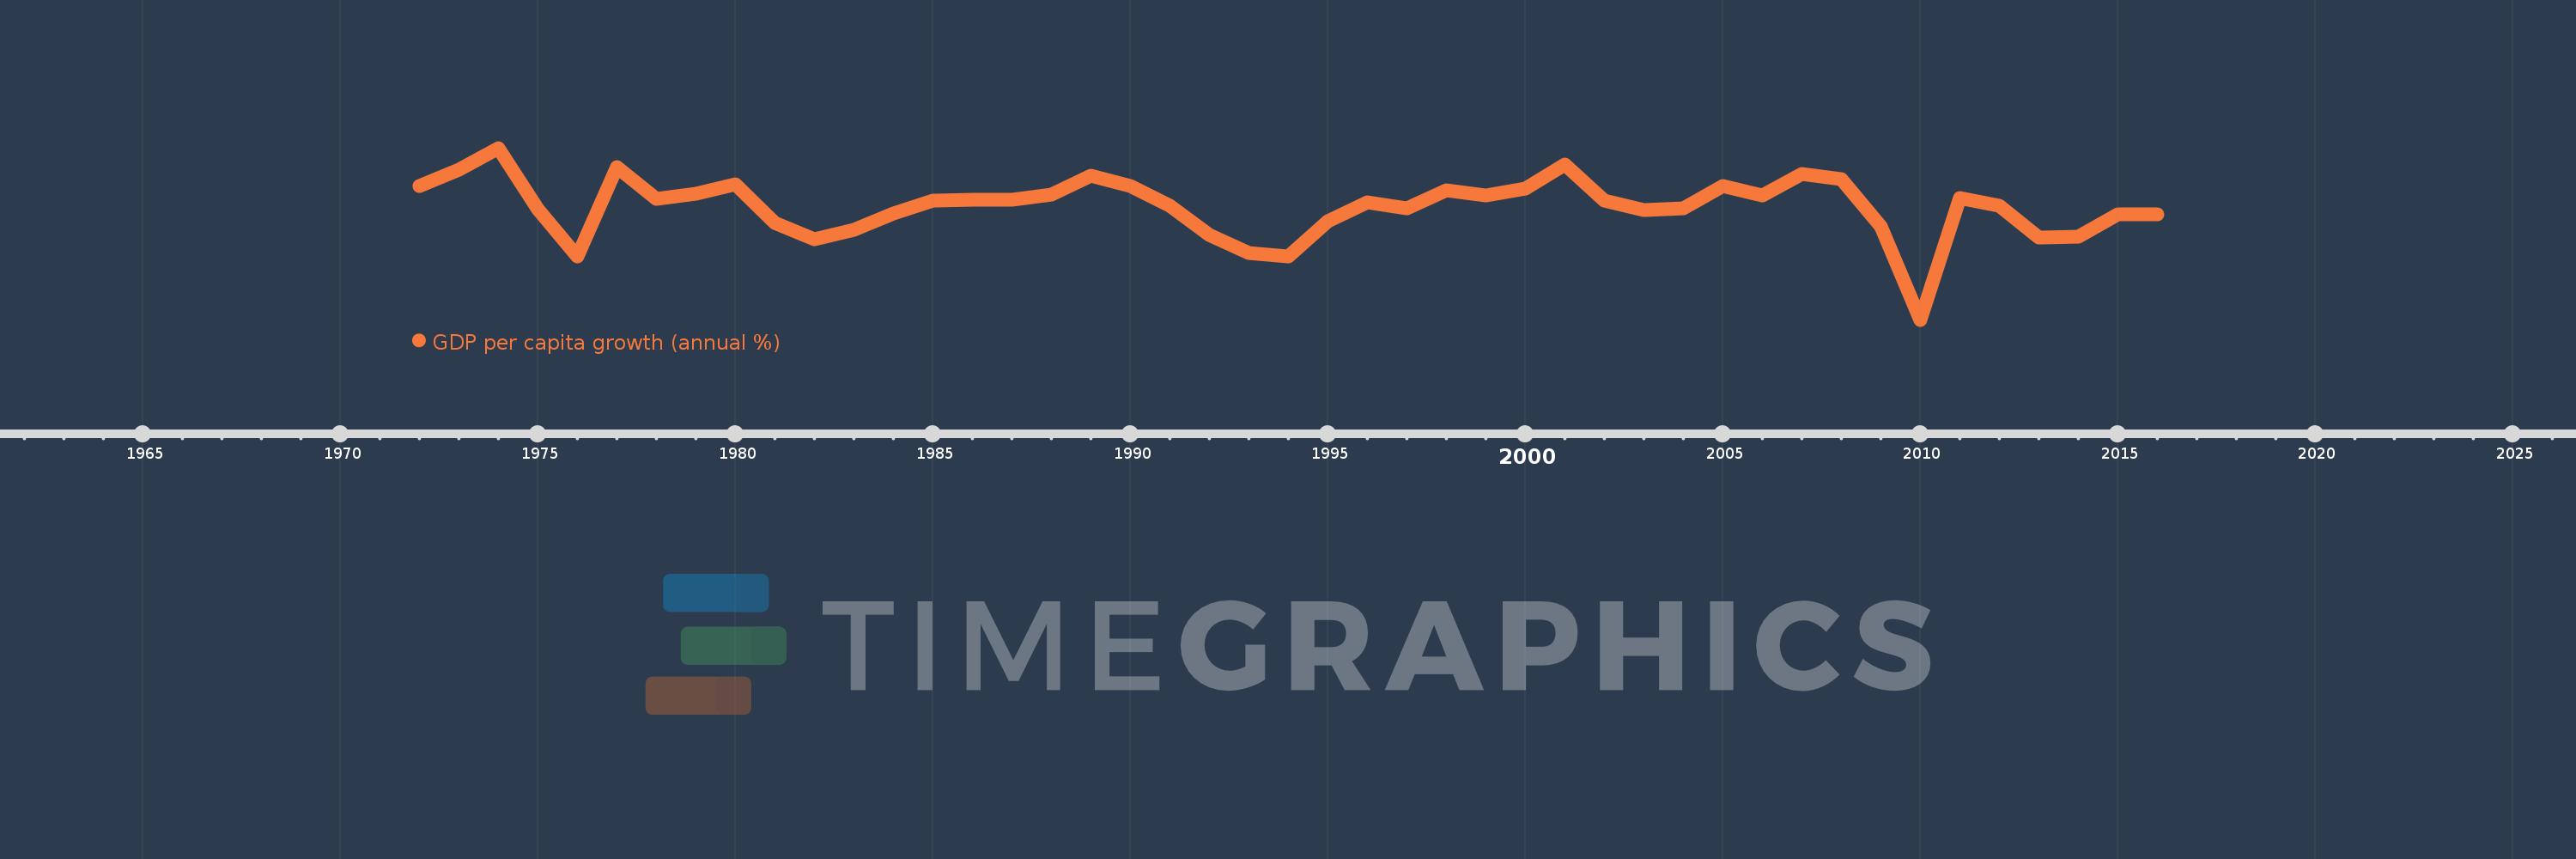
GDP per capita growth (annual %)
2016,2015,2014,2013,2012,2011,2010,2009,2008,2007,2006,2005,2004,2003,2002,2001,2000,1999,1998,1997,1996,1995,1994,1993,1992,1991,1990,1989,1988,1987,1986,1985,1984,1983,1982,1981,1980,1979,1978,1977,1976,1975,1974,1973,1972
This statistics in other country:
AfghanistanAlbaniaAlgeriaAndorraAngolaAntigua and BarbudaArab WorldArgentinaArmeniaArubaAustraliaAustriaAzerbaijanBahamas, TheBahrainBangladeshBarbadosBelarusBelgiumBelizeBeninBermudaBhutanBoliviaBosnia and HerzegovinaBotswanaBrazilBrunei DarussalamBulgariaBurkina FasoBurundiCabo VerdeCambodiaCameroonCanadaCaribbean small statesCayman IslandsCentral African RepublicCentral Europe and the BalticsChadChannel IslandsChileChinaColombiaComorosCongo, Dem. Rep.Congo, Rep.Costa RicaCote d'IvoireCroatiaCubaCyprusCzech RepublicDenmarkDjiboutiDominicaDominican RepublicEarly-demographic dividendEast Asia & PacificEast Asia & Pacific (excluding high income)East Asia & Pacific (IDA & IBRD countries)EcuadorEgypt, Arab Rep.El SalvadorEquatorial GuineaEritreaEstoniaEthiopiaEuro areaEurope & Central AsiaEurope & Central Asia (excluding high income)Europe & Central Asia (IDA & IBRD countries)European UnionFijiFinlandFragile and conflict affected situationsFranceFrench PolynesiaGabonGambia, TheGeorgiaGermanyGhanaGreeceGreenlandGrenadaGuatemalaGuineaGuinea-BissauGuyanaHaitiHeavily indebted poor countries (HIPC)High incomeHondurasHong Kong SAR, ChinaHungaryIBRD onlyIcelandIDA & IBRD totalIDA blendIDA onlyIDA totalIndiaIndonesiaIran, Islamic Rep.IraqIrelandIsle of ManIsraelItalyJamaicaJapanJordanKazakhstanKenyaKiribatiKorea, Rep.KosovoKuwaitKyrgyz RepublicLao PDRLate-demographic dividendLatin America & Caribbean Latin America & Caribbean (excluding high income)Latin America & the Caribbean (IDA & IBRD countries)LatviaLeast developed countries: UN classificationLebanonLesothoLiberiaLibyaLiechtensteinLithuaniaLow & middle incomeLow incomeLower middle incomeLuxembourgMacao SAR, ChinaMacedonia, FYRMadagascarMalawiMalaysiaMaldivesMaliMaltaMarshall IslandsMauritaniaMauritiusMexicoMicronesia, Fed. Sts.Middle East & North AfricaMiddle East & North Africa (excluding high income)Middle East & North Africa (IDA & IBRD countries)Middle incomeMoldovaMonacoMongoliaMontenegroMoroccoMozambiqueMyanmarNamibiaNauruNepalNetherlandsNew CaledoniaNew ZealandNicaraguaNigerNigeriaNorth AmericaNorwayOECD membersOmanOther small statesPacific island small statesPakistanPalauPanamaPapua New GuineaParaguayPeruPhilippinesPolandPortugalPost-demographic dividendPre-demographic dividendPuerto RicoQatarRomaniaRussian FederationRwandaSamoaSan MarinoSao Tome and PrincipeSaudi ArabiaSenegalSerbiaSeychellesSierra LeoneSingaporeSlovak RepublicSloveniaSmall statesSolomon IslandsSomaliaSouth AfricaSouth AsiaSouth Asia (IDA & IBRD)South SudanSpainSri LankaSt. Kitts and NevisSt. LuciaSt. Vincent and the GrenadinesSub-Saharan Africa Sub-Saharan Africa (excluding high income)Sub-Saharan Africa (IDA & IBRD countries)SudanSurinameSwazilandSwedenSwitzerlandSyrian Arab RepublicTajikistanTanzaniaThailandTimor-LesteTogoTongaTrinidad and TobagoTunisiaTurkeyTurkmenistanTuvaluUgandaUkraineUnited Arab EmiratesUnited KingdomUnited StatesUpper middle incomeUruguayUzbekistanVanuatuVenezuela, RBVietnamVirgin Islands (U.S.)West Bank and GazaWorldYemen, Rep.ZambiaZimbabwe Timeline:
This timeline shows a graph from 1972 to 2016 of Europe & Central Asia. No data until 1971. Number of actual observations by date: 45.
Source name:
World Development Indicators
Source organization:
World Bank national accounts data, and OECD National Accounts data files.
Categories, topics:
Economy & Growth
Last updated:
apr 23, 2017
Indicators value changes by year
Minimum:
-4.895
jan 1, 2010
At the date of observation
Value
Absolute change
Change from previous value
jan 1, 1972
2.935
+2.935
0.0%
jan 1, 1973
3.901
+0.966
32.92%
jan 1, 1974
5.154
+1.254
32.14%
jan 1, 1975
1.56
-3.595
-69.74%
jan 1, 1976
-1.21
-2.769
-177.56%
jan 1, 1977
4.018
+5.227
-432.15%
jan 1, 1978
2.168
-1.85
-46.05%
jan 1, 1979
2.501
+0.334
15.39%
jan 1, 1980
3.053
+0.552
22.05%
jan 1, 1981
0.765
-2.288
-74.93%
jan 1, 1982
-0.166
-0.931
-121.63%
jan 1, 1983
0.351
+0.517
-312.31%
jan 1, 1984
1.336
+0.985
280.21%
jan 1, 1985
2.054
+0.718
53.72%
jan 1, 1986
2.147
+0.093
4.53%
jan 1, 1987
2.138
-0.009
-0.42%
jan 1, 1988
2.409
+0.271
12.7%
jan 1, 1989
3.547
+1.138
47.22%
jan 1, 1990
2.922
-0.626
-17.63%
jan 1, 1991
1.787
-1.135
-38.84%
jan 1, 1992
0.042
-1.744
-97.62%
jan 1, 1993
-1.01
-1.052
-2.48K%
jan 1, 1994
-1.201
-0.191
18.87%
jan 1, 1995
0.869
+2.069
-172.36%
jan 1, 1996
1.974
+1.105
127.22%
jan 1, 1997
1.639
-0.335
-16.95%
jan 1, 1998
2.699
+1.06
64.64%
jan 1, 1999
2.352
-0.347
-12.87%
jan 1, 2000
2.784
+0.432
18.39%
jan 1, 2001
4.185
+1.401
50.32%
jan 1, 2002
2.074
-2.111
-50.45%
jan 1, 2003
1.519
-0.555
-26.77%
jan 1, 2004
1.606
+0.087
5.75%
jan 1, 2005
2.947
+1.341
83.53%
jan 1, 2006
2.397
-0.55
-18.66%
jan 1, 2007
3.608
+1.211
50.51%
jan 1, 2008
3.336
-0.272
-7.54%
jan 1, 2009
0.578
-2.758
-82.68%
jan 1, 2010
-4.895
-5.472
-947.26%
jan 1, 2011
2.222
+7.117
-145.4%
jan 1, 2012
1.772
-0.451
-20.27%
jan 1, 2013
-0.105
-1.877
-105.92%
jan 1, 2014
-0.037
+0.068
-64.59%
jan 1, 2015
1.249
+1.286
-3.47K%
jan 1, 2016
1.259
+0.009
0.75%
Ranking of countries by current statistics by years


Comments: