29
/
en
AIzaSyAYiBZKx7MnpbEhh9jyipgxe19OcubqV5w
April 1, 2024
134858
French Polynesia
PYF
true
2
1
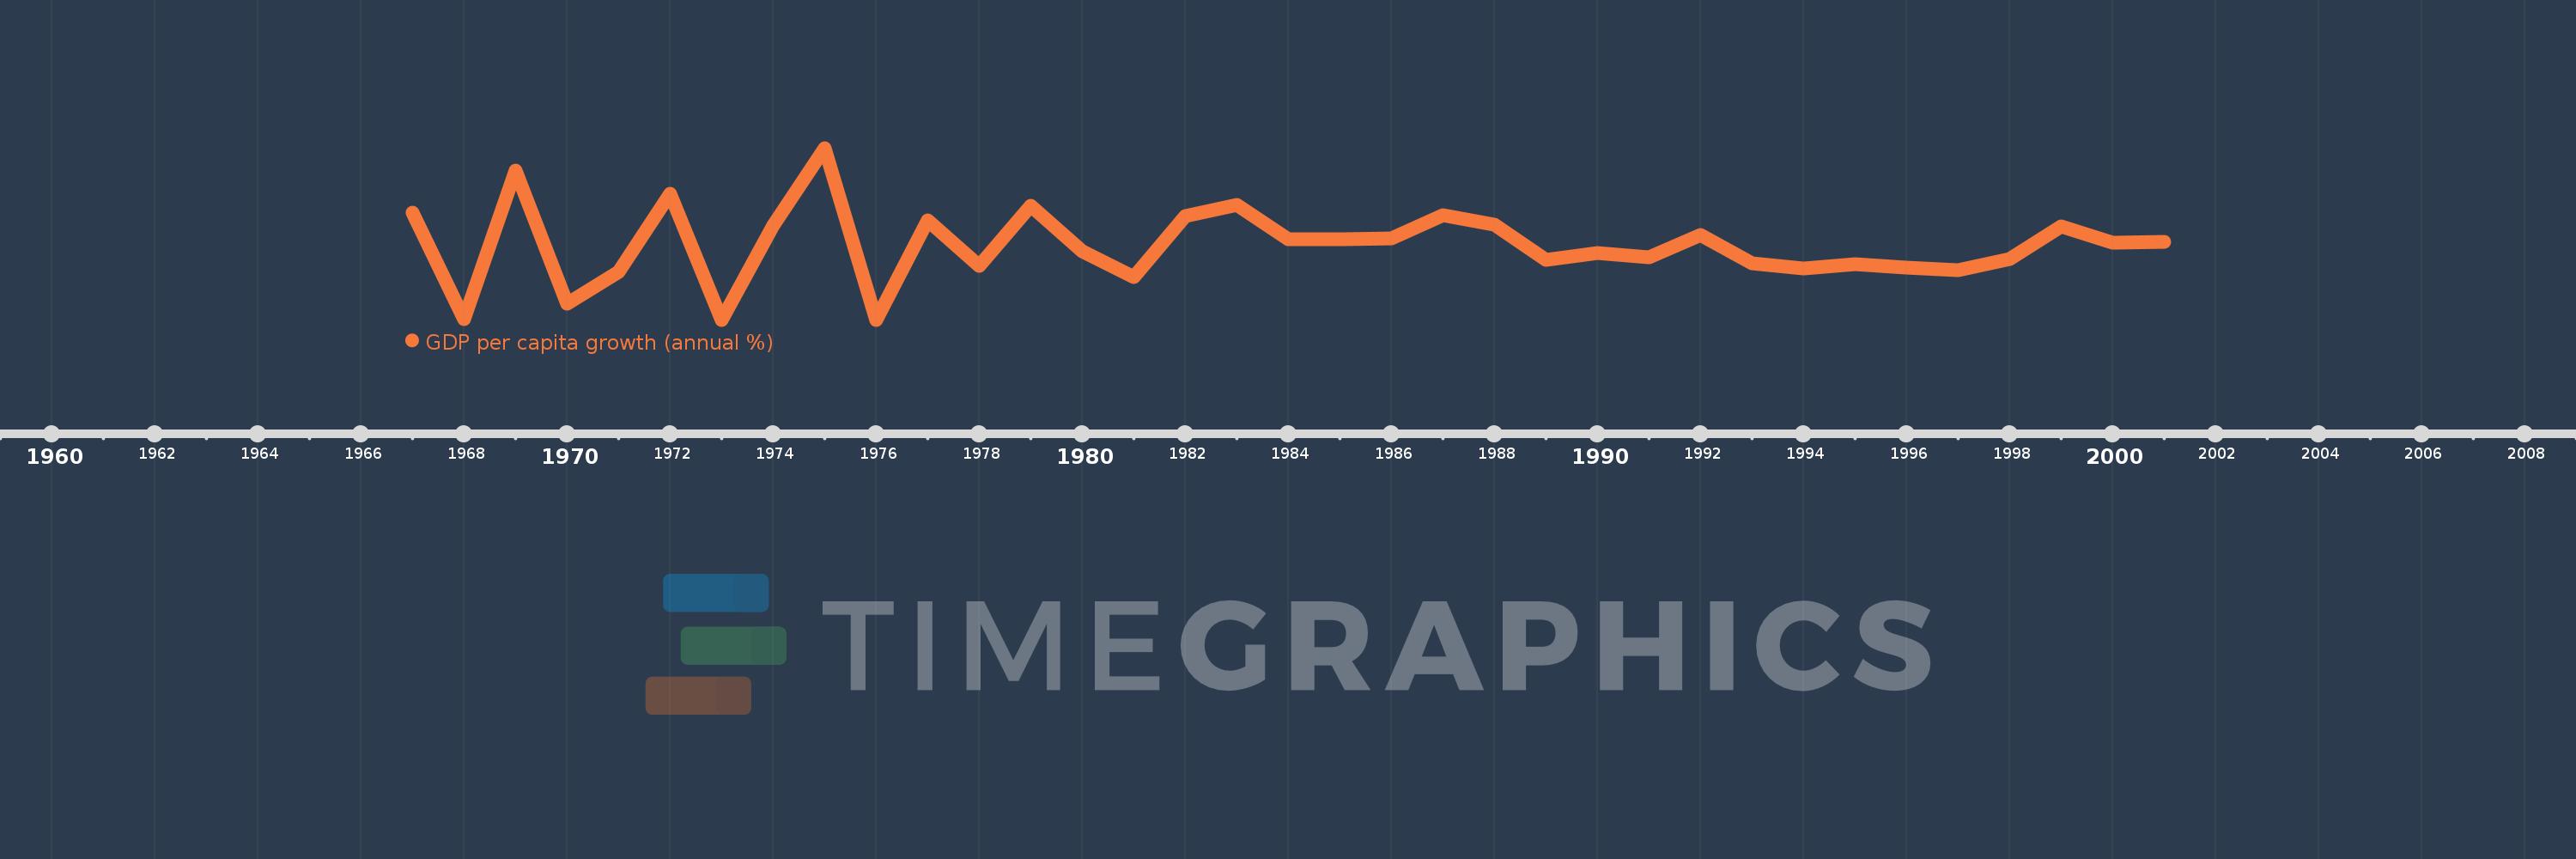
GDP per capita growth (annual %)
2001,2000,1999,1998,1997,1996,1995,1994,1993,1992,1991,1990,1989,1988,1987,1986,1985,1984,1983,1982,1981,1980,1979,1978,1977,1976,1975,1974,1973,1972,1971,1970,1969,1968,1967
This statistics in other country:
AfghanistanAlbaniaAlgeriaAndorraAngolaAntigua and BarbudaArab WorldArgentinaArmeniaArubaAustraliaAustriaAzerbaijanBahamas, TheBahrainBangladeshBarbadosBelarusBelgiumBelizeBeninBermudaBhutanBoliviaBosnia and HerzegovinaBotswanaBrazilBrunei DarussalamBulgariaBurkina FasoBurundiCabo VerdeCambodiaCameroonCanadaCaribbean small statesCayman IslandsCentral African RepublicCentral Europe and the BalticsChadChannel IslandsChileChinaColombiaComorosCongo, Dem. Rep.Congo, Rep.Costa RicaCote d'IvoireCroatiaCubaCyprusCzech RepublicDenmarkDjiboutiDominicaDominican RepublicEarly-demographic dividendEast Asia & PacificEast Asia & Pacific (excluding high income)East Asia & Pacific (IDA & IBRD countries)EcuadorEgypt, Arab Rep.El SalvadorEquatorial GuineaEritreaEstoniaEthiopiaEuro areaEurope & Central AsiaEurope & Central Asia (excluding high income)Europe & Central Asia (IDA & IBRD countries)European UnionFijiFinlandFragile and conflict affected situationsFranceFrench PolynesiaGabonGambia, TheGeorgiaGermanyGhanaGreeceGreenlandGrenadaGuatemalaGuineaGuinea-BissauGuyanaHaitiHeavily indebted poor countries (HIPC)High incomeHondurasHong Kong SAR, ChinaHungaryIBRD onlyIcelandIDA & IBRD totalIDA blendIDA onlyIDA totalIndiaIndonesiaIran, Islamic Rep.IraqIrelandIsle of ManIsraelItalyJamaicaJapanJordanKazakhstanKenyaKiribatiKorea, Rep.KosovoKuwaitKyrgyz RepublicLao PDRLate-demographic dividendLatin America & Caribbean Latin America & Caribbean (excluding high income)Latin America & the Caribbean (IDA & IBRD countries)LatviaLeast developed countries: UN classificationLebanonLesothoLiberiaLibyaLiechtensteinLithuaniaLow & middle incomeLow incomeLower middle incomeLuxembourgMacao SAR, ChinaMacedonia, FYRMadagascarMalawiMalaysiaMaldivesMaliMaltaMarshall IslandsMauritaniaMauritiusMexicoMicronesia, Fed. Sts.Middle East & North AfricaMiddle East & North Africa (excluding high income)Middle East & North Africa (IDA & IBRD countries)Middle incomeMoldovaMonacoMongoliaMontenegroMoroccoMozambiqueMyanmarNamibiaNauruNepalNetherlandsNew CaledoniaNew ZealandNicaraguaNigerNigeriaNorth AmericaNorwayOECD membersOmanOther small statesPacific island small statesPakistanPalauPanamaPapua New GuineaParaguayPeruPhilippinesPolandPortugalPost-demographic dividendPre-demographic dividendPuerto RicoQatarRomaniaRussian FederationRwandaSamoaSan MarinoSao Tome and PrincipeSaudi ArabiaSenegalSerbiaSeychellesSierra LeoneSingaporeSlovak RepublicSloveniaSmall statesSolomon IslandsSomaliaSouth AfricaSouth AsiaSouth Asia (IDA & IBRD)South SudanSpainSri LankaSt. Kitts and NevisSt. LuciaSt. Vincent and the GrenadinesSub-Saharan Africa Sub-Saharan Africa (excluding high income)Sub-Saharan Africa (IDA & IBRD countries)SudanSurinameSwazilandSwedenSwitzerlandSyrian Arab RepublicTajikistanTanzaniaThailandTimor-LesteTogoTongaTrinidad and TobagoTunisiaTurkeyTurkmenistanTuvaluUgandaUkraineUnited Arab EmiratesUnited KingdomUnited StatesUpper middle incomeUruguayUzbekistanVanuatuVenezuela, RBVietnamVirgin Islands (U.S.)West Bank and GazaWorldYemen, Rep.ZambiaZimbabwe Timeline:
This timeline shows a graph from 1967 to 2001 of French Polynesia. No data until 1966. Number of actual observations by date: 35.
Source name:
World Development Indicators
Source organization:
World Bank national accounts data, and OECD National Accounts data files.
Categories, topics:
Economy & Growth
Last updated:
apr 23, 2017
Indicators value changes by year
Minimum:
-7.914
jan 1, 1976
At the date of observation
Value
Absolute change
Change from previous value
jan 1, 1967
5.85
+5.85
0.0%
jan 1, 1968
-7.883
-13.732
-234.76%
jan 1, 1969
11.202
+19.085
-242.11%
jan 1, 1970
-5.849
-17.051
-152.21%
jan 1, 1971
-1.719
+4.129
-70.6%
jan 1, 1972
8.264
+9.984
-580.69%
jan 1, 1973
-7.892
-16.157
-195.5%
jan 1, 1974
4.211
+12.104
-153.36%
jan 1, 1975
14.15
+9.939
235.99%
jan 1, 1976
-7.914
-22.064
-155.93%
jan 1, 1977
4.892
+12.806
-161.81%
jan 1, 1978
-0.952
-5.844
-119.47%
jan 1, 1979
6.692
+7.644
-802.56%
jan 1, 1980
0.916
-5.776
-86.31%
jan 1, 1981
-2.432
-3.348
-365.43%
jan 1, 1982
5.353
+7.785
-320.15%
jan 1, 1983
6.798
+1.445
26.99%
jan 1, 1984
2.397
-4.401
-64.74%
jan 1, 1985
2.445
+0.048
2.0%
jan 1, 1986
2.512
+0.067
2.74%
jan 1, 1987
5.474
+2.962
117.89%
jan 1, 1988
4.269
-1.205
-22.01%
jan 1, 1989
-0.182
-4.451
-104.26%
jan 1, 1990
0.61
+0.792
-435.57%
jan 1, 1991
0.077
-0.533
-87.4%
jan 1, 1992
3.005
+2.928
3.81K%
jan 1, 1993
-0.697
-3.702
-123.2%
jan 1, 1994
-1.38
-0.683
97.94%
jan 1, 1995
-0.741
+0.639
-46.28%
jan 1, 1996
-1.189
-0.448
60.38%
jan 1, 1997
-1.567
-0.378
31.83%
jan 1, 1998
-0.128
+1.439
-91.85%
jan 1, 1999
4.04
+4.167
-3.26K%
jan 1, 2000
1.957
-2.082
-51.55%
jan 1, 2001
2.11
+0.153
7.83%
Ranking of countries by current statistics by years


Comments: