29
/
en
AIzaSyAYiBZKx7MnpbEhh9jyipgxe19OcubqV5w
April 1, 2024
193028
Mauritania
MRT
true
2
1
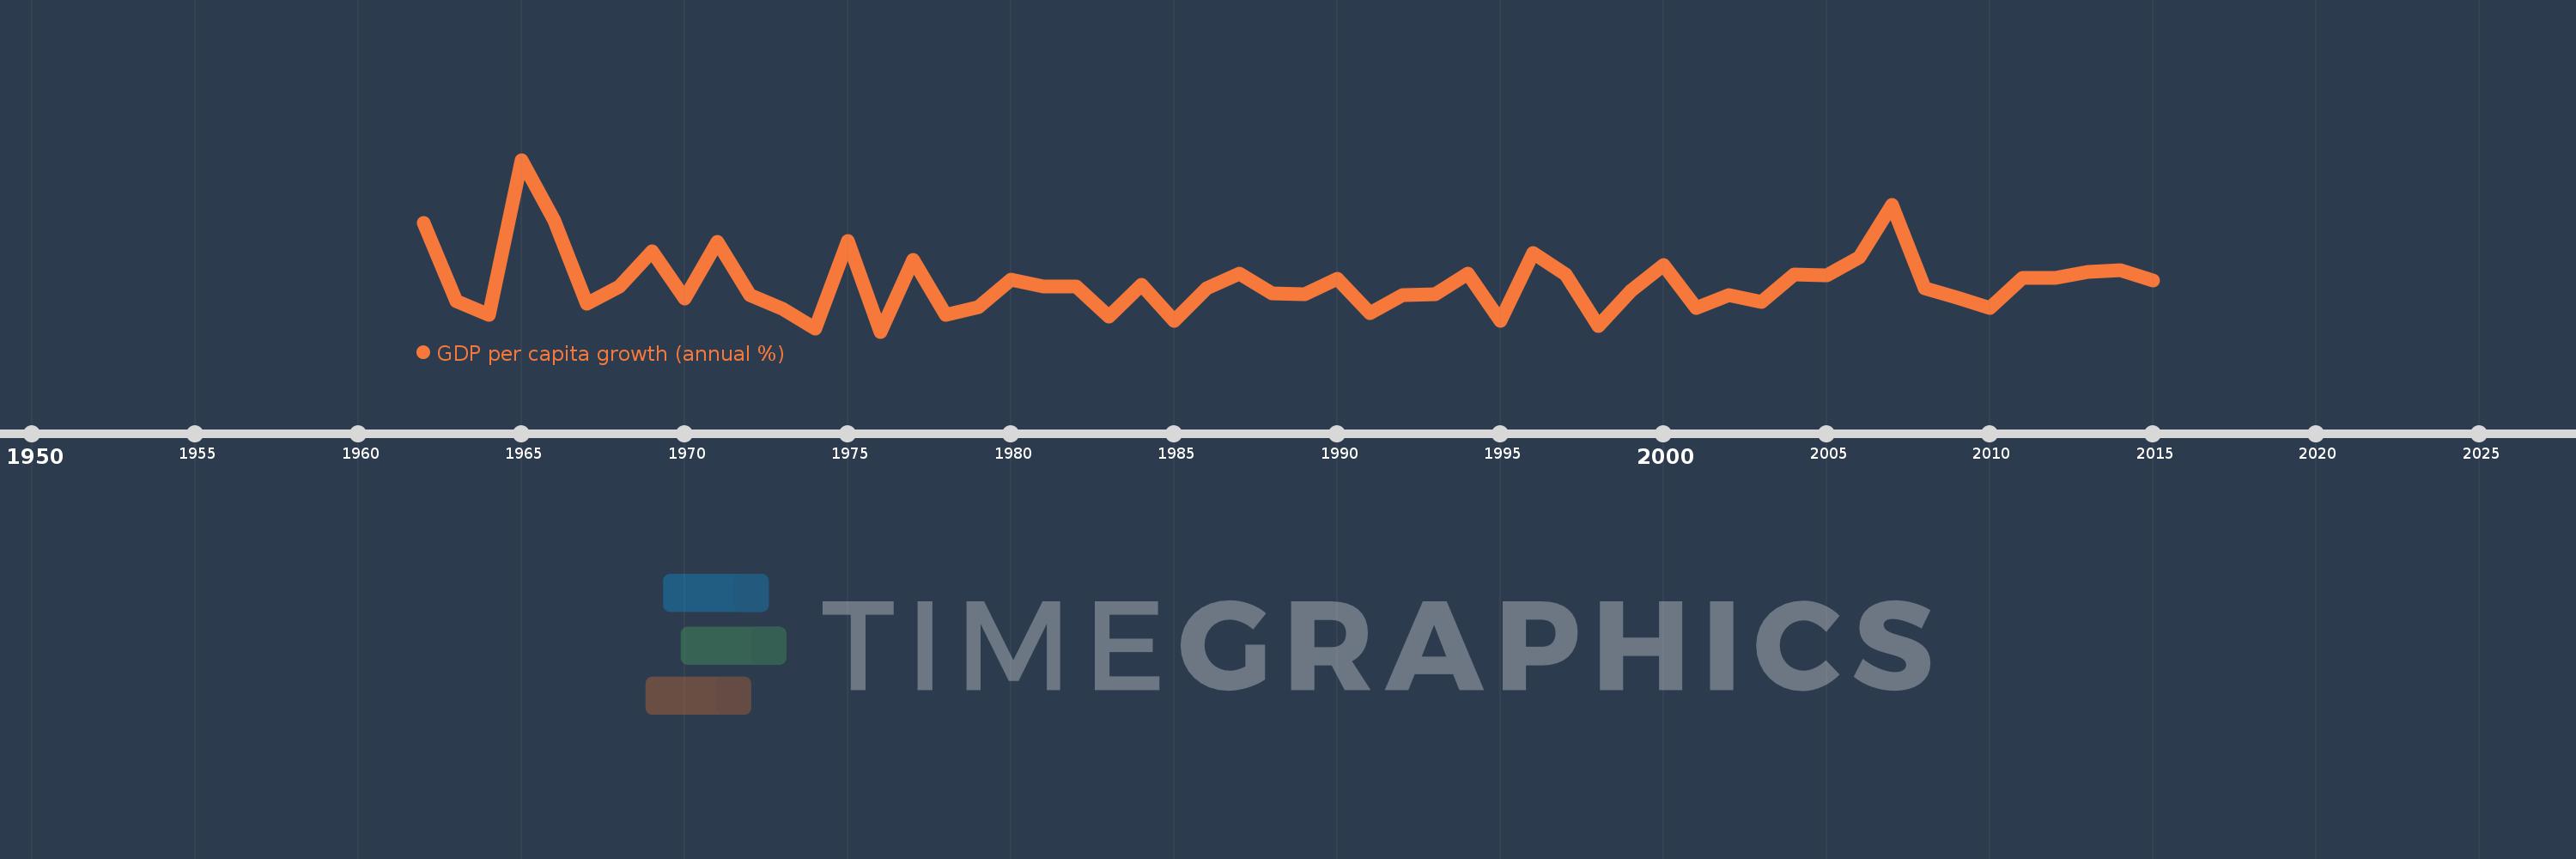
GDP per capita growth (annual %)
2015,2014,2013,2012,2011,2010,2009,2008,2007,2006,2005,2004,2003,2002,2001,2000,1999,1998,1997,1996,1995,1994,1993,1992,1991,1990,1989,1988,1987,1986,1985,1984,1983,1982,1981,1980,1979,1978,1977,1976,1975,1974,1973,1972,1971,1970,1969,1968,1967,1966,1965,1964,1963,1962
This statistics in other country:
AfghanistanAlbaniaAlgeriaAndorraAngolaAntigua and BarbudaArab WorldArgentinaArmeniaArubaAustraliaAustriaAzerbaijanBahamas, TheBahrainBangladeshBarbadosBelarusBelgiumBelizeBeninBermudaBhutanBoliviaBosnia and HerzegovinaBotswanaBrazilBrunei DarussalamBulgariaBurkina FasoBurundiCabo VerdeCambodiaCameroonCanadaCaribbean small statesCayman IslandsCentral African RepublicCentral Europe and the BalticsChadChannel IslandsChileChinaColombiaComorosCongo, Dem. Rep.Congo, Rep.Costa RicaCote d'IvoireCroatiaCubaCyprusCzech RepublicDenmarkDjiboutiDominicaDominican RepublicEarly-demographic dividendEast Asia & PacificEast Asia & Pacific (excluding high income)East Asia & Pacific (IDA & IBRD countries)EcuadorEgypt, Arab Rep.El SalvadorEquatorial GuineaEritreaEstoniaEthiopiaEuro areaEurope & Central AsiaEurope & Central Asia (excluding high income)Europe & Central Asia (IDA & IBRD countries)European UnionFijiFinlandFragile and conflict affected situationsFranceFrench PolynesiaGabonGambia, TheGeorgiaGermanyGhanaGreeceGreenlandGrenadaGuatemalaGuineaGuinea-BissauGuyanaHaitiHeavily indebted poor countries (HIPC)High incomeHondurasHong Kong SAR, ChinaHungaryIBRD onlyIcelandIDA & IBRD totalIDA blendIDA onlyIDA totalIndiaIndonesiaIran, Islamic Rep.IraqIrelandIsle of ManIsraelItalyJamaicaJapanJordanKazakhstanKenyaKiribatiKorea, Rep.KosovoKuwaitKyrgyz RepublicLao PDRLate-demographic dividendLatin America & Caribbean Latin America & Caribbean (excluding high income)Latin America & the Caribbean (IDA & IBRD countries)LatviaLeast developed countries: UN classificationLebanonLesothoLiberiaLibyaLiechtensteinLithuaniaLow & middle incomeLow incomeLower middle incomeLuxembourgMacao SAR, ChinaMacedonia, FYRMadagascarMalawiMalaysiaMaldivesMaliMaltaMarshall IslandsMauritaniaMauritiusMexicoMicronesia, Fed. Sts.Middle East & North AfricaMiddle East & North Africa (excluding high income)Middle East & North Africa (IDA & IBRD countries)Middle incomeMoldovaMonacoMongoliaMontenegroMoroccoMozambiqueMyanmarNamibiaNauruNepalNetherlandsNew CaledoniaNew ZealandNicaraguaNigerNigeriaNorth AmericaNorwayOECD membersOmanOther small statesPacific island small statesPakistanPalauPanamaPapua New GuineaParaguayPeruPhilippinesPolandPortugalPost-demographic dividendPre-demographic dividendPuerto RicoQatarRomaniaRussian FederationRwandaSamoaSan MarinoSao Tome and PrincipeSaudi ArabiaSenegalSerbiaSeychellesSierra LeoneSingaporeSlovak RepublicSloveniaSmall statesSolomon IslandsSomaliaSouth AfricaSouth AsiaSouth Asia (IDA & IBRD)South SudanSpainSri LankaSt. Kitts and NevisSt. LuciaSt. Vincent and the GrenadinesSub-Saharan Africa Sub-Saharan Africa (excluding high income)Sub-Saharan Africa (IDA & IBRD countries)SudanSurinameSwazilandSwedenSwitzerlandSyrian Arab RepublicTajikistanTanzaniaThailandTimor-LesteTogoTongaTrinidad and TobagoTunisiaTurkeyTurkmenistanTuvaluUgandaUkraineUnited Arab EmiratesUnited KingdomUnited StatesUpper middle incomeUruguayUzbekistanVanuatuVenezuela, RBVietnamVirgin Islands (U.S.)West Bank and GazaWorldYemen, Rep.ZambiaZimbabwe Timeline:
This timeline shows a graph from 1962 to 2015 of Mauritania. No data until 1961. Number of actual observations by date: 54.
Source name:
World Development Indicators
Source organization:
World Bank national accounts data, and OECD National Accounts data files.
Categories, topics:
Economy & Growth
Last updated:
apr 23, 2017
Indicators value changes by year
Minimum:
-7.843
jan 1, 1976
Maximum:
24.017
jan 1, 1965
At the date of observation
Value
Absolute change
Change from previous value
jan 1, 1962
12.253
+12.253
0.0%
jan 1, 1963
-2.148
-14.401
-117.53%
jan 1, 1964
-4.795
-2.646
123.18%
jan 1, 1965
24.017
+28.811
-600.91%
jan 1, 1966
12.789
-11.228
-46.75%
jan 1, 1967
-2.664
-15.452
-120.83%
jan 1, 1968
0.575
+3.238
-121.57%
jan 1, 1969
7.013
+6.439
1.12K%
jan 1, 1970
-1.674
-8.687
-123.86%
jan 1, 1971
8.758
+10.432
-623.26%
jan 1, 1972
-1.087
-9.845
-112.42%
jan 1, 1973
-3.583
-2.495
229.48%
jan 1, 1974
-7.319
-3.736
104.27%
jan 1, 1975
8.955
+16.273
-222.35%
jan 1, 1976
-7.843
-16.797
-187.58%
jan 1, 1977
5.455
+13.297
-169.55%
jan 1, 1978
-4.666
-10.12
-185.54%
jan 1, 1979
-3.324
+1.342
-28.76%
jan 1, 1980
1.828
+5.151
-154.99%
jan 1, 1981
0.455
-1.372
-75.09%
jan 1, 1982
0.534
+0.079
17.3%
jan 1, 1983
-5.089
-5.623
-1.05K%
jan 1, 1984
0.832
+5.921
-116.35%
jan 1, 1985
-5.905
-6.737
-809.72%
jan 1, 1986
0.184
+6.089
-103.12%
jan 1, 1987
2.87
+2.686
1.46K%
jan 1, 1988
-0.813
-3.683
-128.31%
jan 1, 1989
-0.981
-0.168
20.68%
jan 1, 1990
1.977
+2.957
-301.57%
jan 1, 1991
-4.431
-6.408
-324.16%
jan 1, 1992
-1.006
+3.425
-77.3%
jan 1, 1993
-0.957
+0.049
-4.92%
jan 1, 1994
2.895
+3.852
-402.69%
jan 1, 1995
-5.821
-8.716
-301.05%
jan 1, 1996
6.657
+12.478
-214.36%
jan 1, 1997
2.746
-3.911
-58.76%
jan 1, 1998
-6.851
-9.596
-349.52%
jan 1, 1999
-0.253
+6.598
-96.31%
jan 1, 2000
4.503
+4.756
-1.88K%
jan 1, 2001
-3.427
-7.93
-176.12%
jan 1, 2002
-1.095
+2.333
-68.06%
jan 1, 2003
-2.412
-1.317
120.31%
jan 1, 2004
2.771
+5.183
-214.91%
jan 1, 2005
2.635
-0.136
-4.91%
jan 1, 2006
5.888
+3.252
123.4%
jan 1, 2007
15.654
+9.767
165.89%
jan 1, 2008
0.145
-15.509
-99.07%
jan 1, 2009
-1.474
-1.619
-1.12K%
jan 1, 2010
-3.511
-2.037
138.24%
jan 1, 2011
2.163
+5.675
-161.62%
jan 1, 2012
2.094
-0.07
-3.22%
jan 1, 2013
3.166
+1.073
51.23%
jan 1, 2014
3.471
+0.304
9.61%
jan 1, 2015
1.661
-1.809
-52.13%
Ranking of countries by current statistics by years


Comments: