29
/
en
AIzaSyAYiBZKx7MnpbEhh9jyipgxe19OcubqV5w
April 1, 2024
160089
Isle of Man
IMN
true
2
1
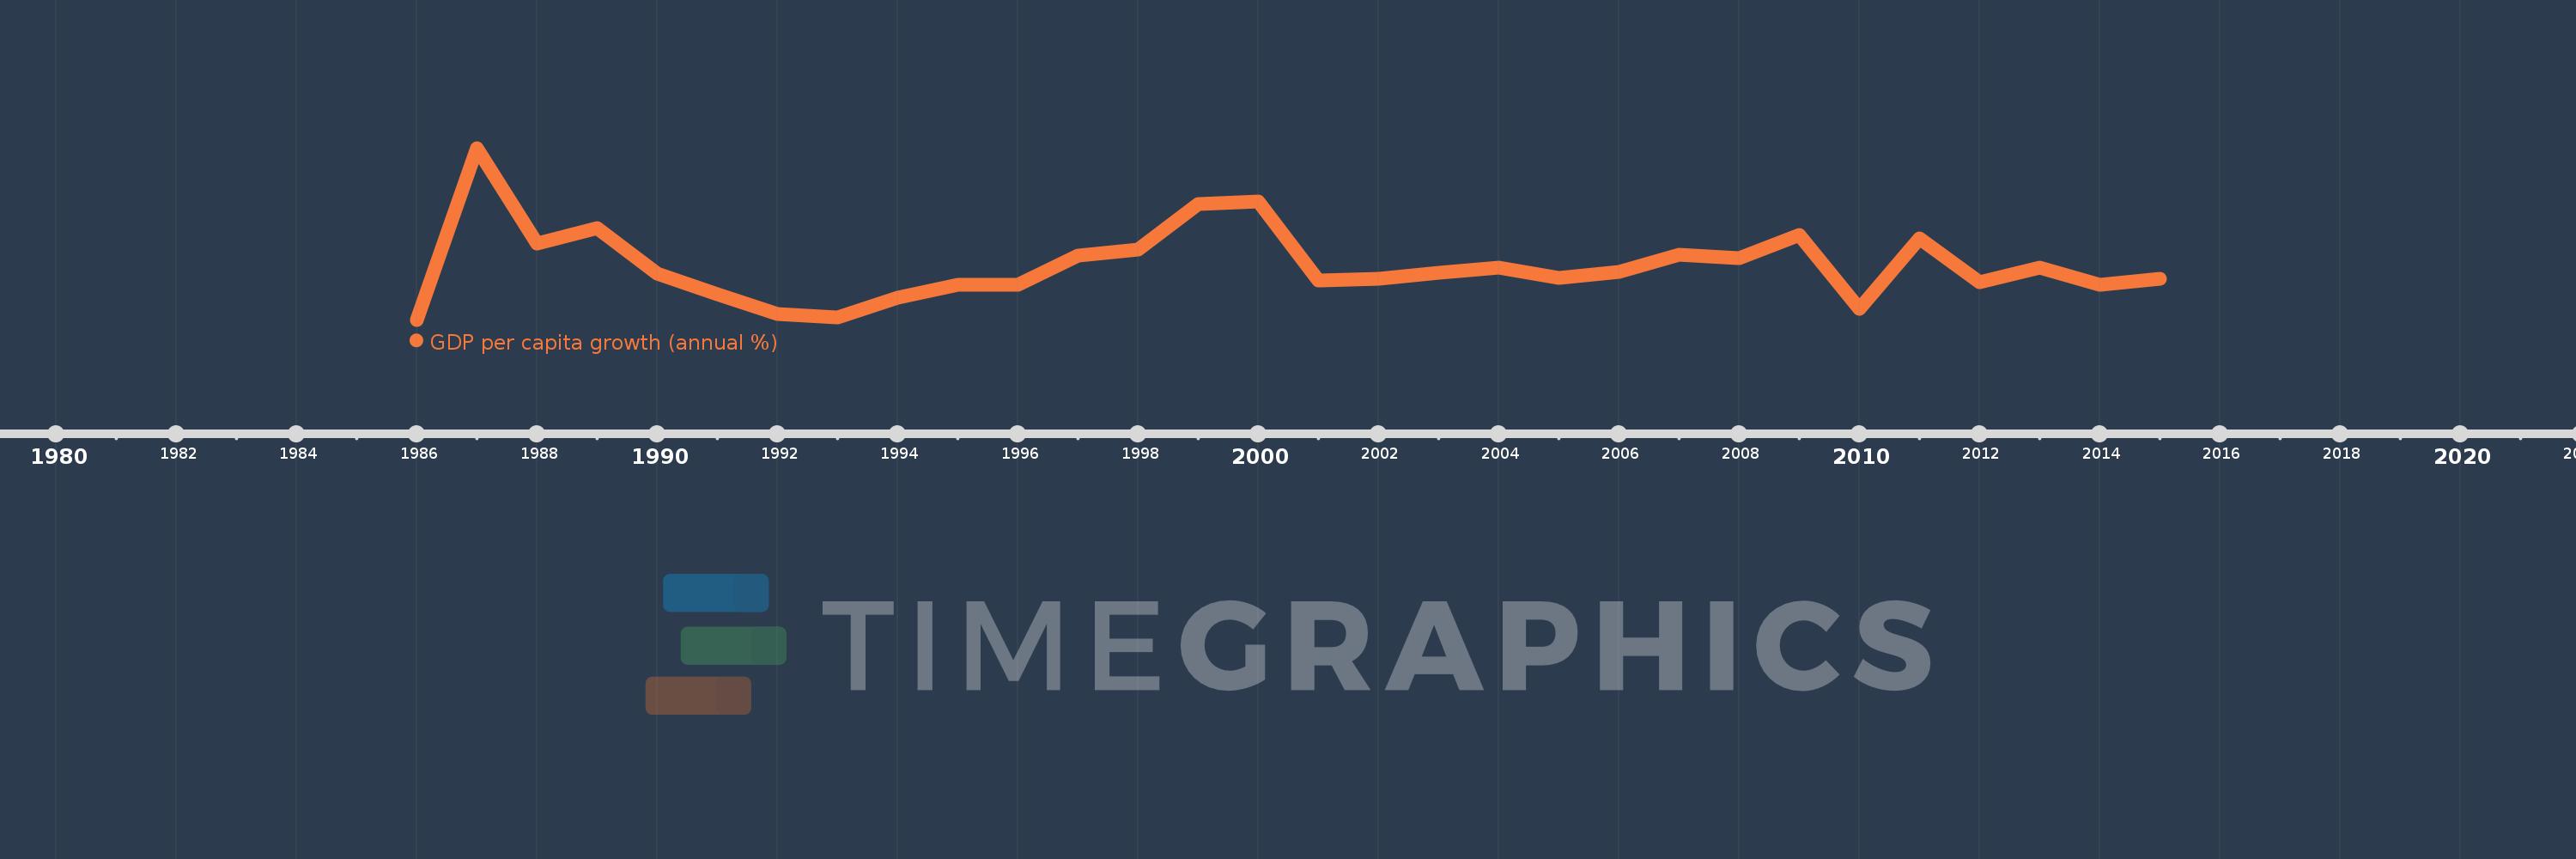
GDP per capita growth (annual %)
2015,2014,2013,2012,2011,2010,2009,2008,2007,2006,2005,2004,2003,2002,2001,2000,1999,1998,1997,1996,1995,1994,1993,1992,1991,1990,1989,1988,1987,1986
This statistics in other country:
AfghanistanAlbaniaAlgeriaAndorraAngolaAntigua and BarbudaArab WorldArgentinaArmeniaArubaAustraliaAustriaAzerbaijanBahamas, TheBahrainBangladeshBarbadosBelarusBelgiumBelizeBeninBermudaBhutanBoliviaBosnia and HerzegovinaBotswanaBrazilBrunei DarussalamBulgariaBurkina FasoBurundiCabo VerdeCambodiaCameroonCanadaCaribbean small statesCayman IslandsCentral African RepublicCentral Europe and the BalticsChadChannel IslandsChileChinaColombiaComorosCongo, Dem. Rep.Congo, Rep.Costa RicaCote d'IvoireCroatiaCubaCyprusCzech RepublicDenmarkDjiboutiDominicaDominican RepublicEarly-demographic dividendEast Asia & PacificEast Asia & Pacific (excluding high income)East Asia & Pacific (IDA & IBRD countries)EcuadorEgypt, Arab Rep.El SalvadorEquatorial GuineaEritreaEstoniaEthiopiaEuro areaEurope & Central AsiaEurope & Central Asia (excluding high income)Europe & Central Asia (IDA & IBRD countries)European UnionFijiFinlandFragile and conflict affected situationsFranceFrench PolynesiaGabonGambia, TheGeorgiaGermanyGhanaGreeceGreenlandGrenadaGuatemalaGuineaGuinea-BissauGuyanaHaitiHeavily indebted poor countries (HIPC)High incomeHondurasHong Kong SAR, ChinaHungaryIBRD onlyIcelandIDA & IBRD totalIDA blendIDA onlyIDA totalIndiaIndonesiaIran, Islamic Rep.IraqIrelandIsle of ManIsraelItalyJamaicaJapanJordanKazakhstanKenyaKiribatiKorea, Rep.KosovoKuwaitKyrgyz RepublicLao PDRLate-demographic dividendLatin America & Caribbean Latin America & Caribbean (excluding high income)Latin America & the Caribbean (IDA & IBRD countries)LatviaLeast developed countries: UN classificationLebanonLesothoLiberiaLibyaLiechtensteinLithuaniaLow & middle incomeLow incomeLower middle incomeLuxembourgMacao SAR, ChinaMacedonia, FYRMadagascarMalawiMalaysiaMaldivesMaliMaltaMarshall IslandsMauritaniaMauritiusMexicoMicronesia, Fed. Sts.Middle East & North AfricaMiddle East & North Africa (excluding high income)Middle East & North Africa (IDA & IBRD countries)Middle incomeMoldovaMonacoMongoliaMontenegroMoroccoMozambiqueMyanmarNamibiaNauruNepalNetherlandsNew CaledoniaNew ZealandNicaraguaNigerNigeriaNorth AmericaNorwayOECD membersOmanOther small statesPacific island small statesPakistanPalauPanamaPapua New GuineaParaguayPeruPhilippinesPolandPortugalPost-demographic dividendPre-demographic dividendPuerto RicoQatarRomaniaRussian FederationRwandaSamoaSan MarinoSao Tome and PrincipeSaudi ArabiaSenegalSerbiaSeychellesSierra LeoneSingaporeSlovak RepublicSloveniaSmall statesSolomon IslandsSomaliaSouth AfricaSouth AsiaSouth Asia (IDA & IBRD)South SudanSpainSri LankaSt. Kitts and NevisSt. LuciaSt. Vincent and the GrenadinesSub-Saharan Africa Sub-Saharan Africa (excluding high income)Sub-Saharan Africa (IDA & IBRD countries)SudanSurinameSwazilandSwedenSwitzerlandSyrian Arab RepublicTajikistanTanzaniaThailandTimor-LesteTogoTongaTrinidad and TobagoTunisiaTurkeyTurkmenistanTuvaluUgandaUkraineUnited Arab EmiratesUnited KingdomUnited StatesUpper middle incomeUruguayUzbekistanVanuatuVenezuela, RBVietnamVirgin Islands (U.S.)West Bank and GazaWorldYemen, Rep.ZambiaZimbabwe Timeline:
This timeline shows a graph from 1986 to 2015 of Isle of Man. No data until 1985. Number of actual observations by date: 30.
Source name:
World Development Indicators
Source organization:
World Bank national accounts data, and OECD National Accounts data files.
Categories, topics:
Economy & Growth
Last updated:
apr 23, 2017
Indicators value changes by year
Maximum:
17.683
jan 1, 1987
At the date of observation
Value
Absolute change
Change from previous value
jan 1, 1986
0.047
+0.047
0.0%
jan 1, 1987
17.683
+17.637
37.91K%
jan 1, 1988
7.872
-9.811
-55.48%
jan 1, 1989
9.436
+1.564
19.87%
jan 1, 1990
4.743
-4.694
-49.74%
jan 1, 1991
2.636
-2.107
-44.43%
jan 1, 1992
0.673
-1.963
-74.47%
jan 1, 1993
0.302
-0.37
-55.05%
jan 1, 1994
2.31
+2.008
663.68%
jan 1, 1995
3.656
+1.346
58.25%
jan 1, 1996
3.624
-0.032
-0.88%
jan 1, 1997
6.655
+3.032
83.66%
jan 1, 1998
7.231
+0.576
8.66%
jan 1, 1999
11.938
+4.707
65.09%
jan 1, 2000
12.156
+0.218
1.82%
jan 1, 2001
4.067
-8.089
-66.54%
jan 1, 2002
4.287
+0.22
5.41%
jan 1, 2003
4.909
+0.622
14.51%
jan 1, 2004
5.443
+0.534
10.88%
jan 1, 2005
4.327
-1.116
-20.51%
jan 1, 2006
4.965
+0.639
14.76%
jan 1, 2007
6.684
+1.719
34.61%
jan 1, 2008
6.402
-0.282
-4.22%
jan 1, 2009
8.756
+2.354
36.76%
jan 1, 2010
1.136
-7.62
-87.03%
jan 1, 2011
8.405
+7.269
640.02%
jan 1, 2012
3.901
-4.505
-53.59%
jan 1, 2013
5.37
+1.47
37.68%
jan 1, 2014
3.668
-1.702
-31.69%
jan 1, 2015
4.229
+0.561
15.31%
Ranking of countries by current statistics by years


Comments: