29
/
en
AIzaSyAYiBZKx7MnpbEhh9jyipgxe19OcubqV5w
April 1, 2024
254126
Suriname
SUR
true
2
1
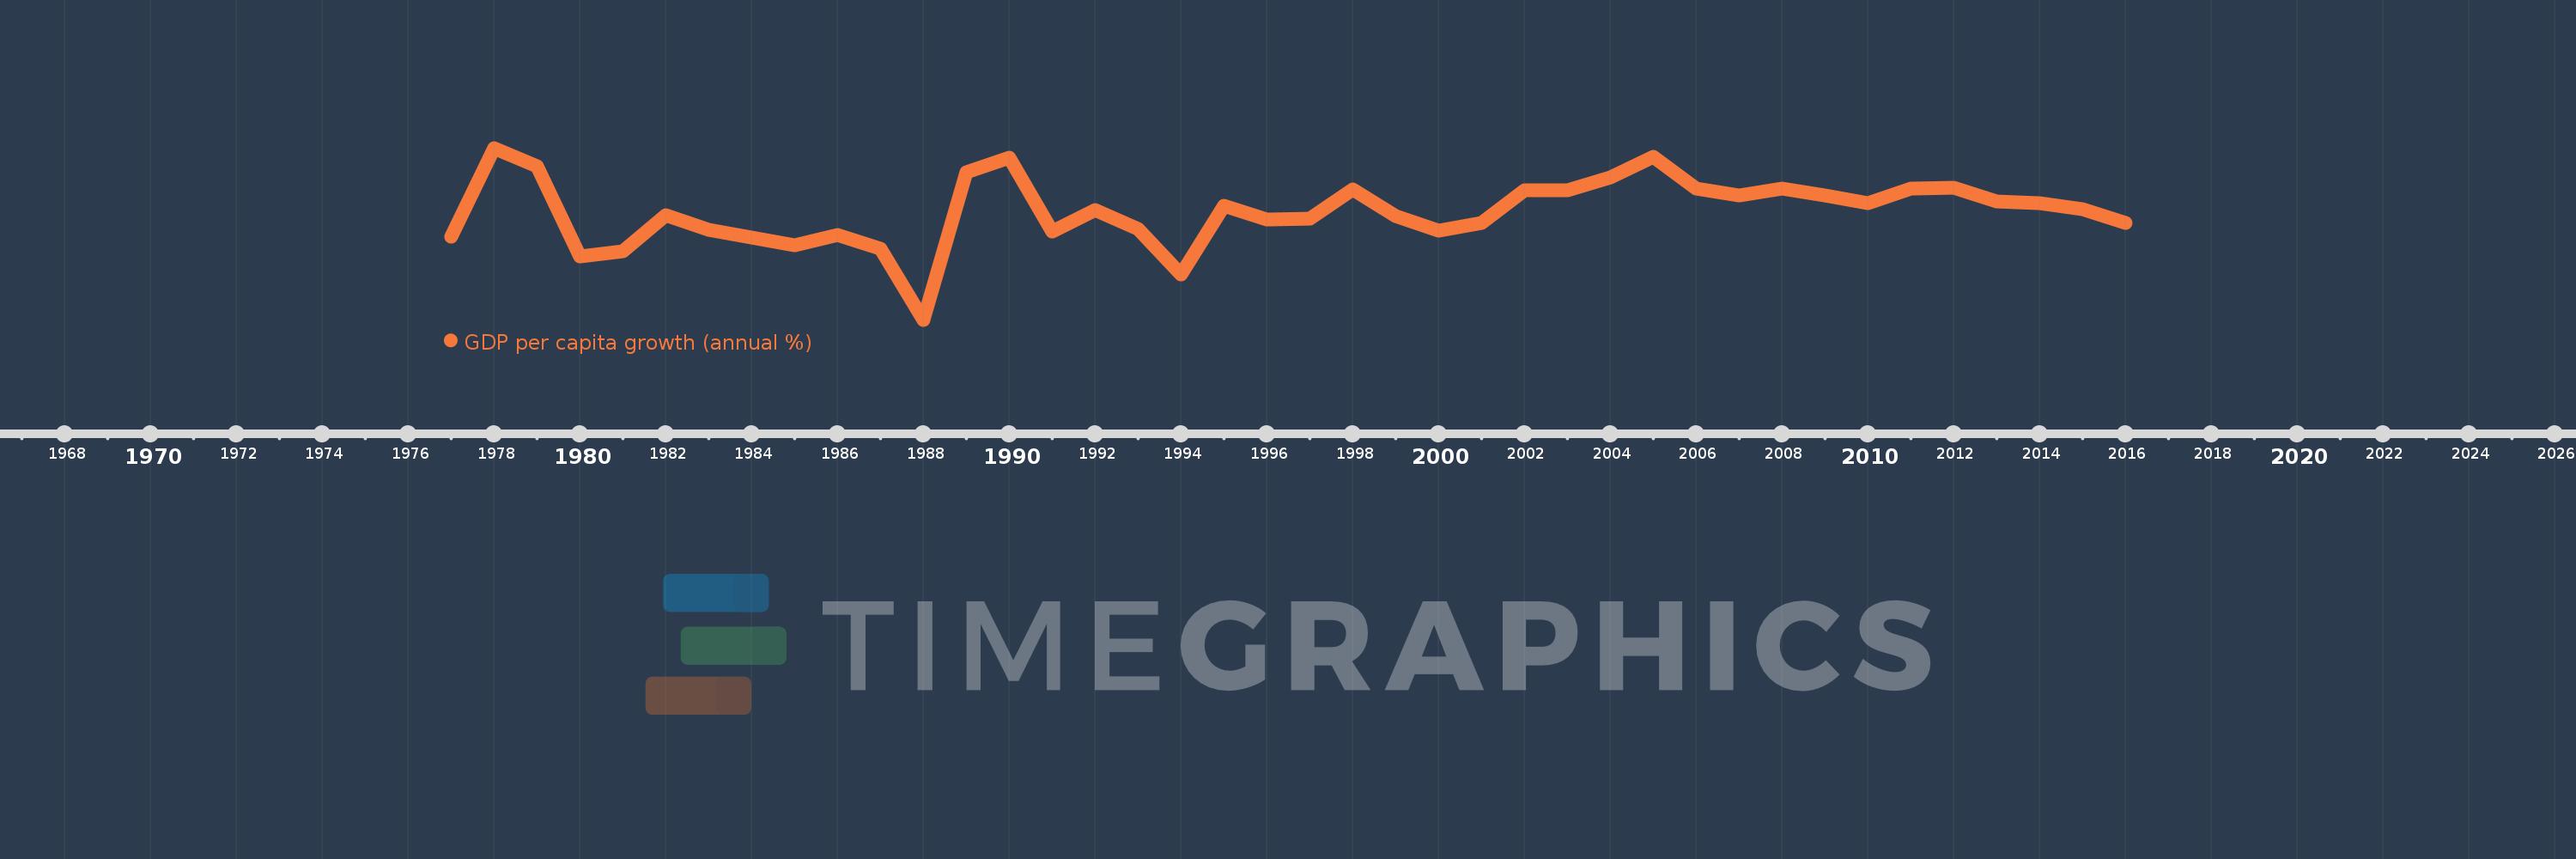
GDP per capita growth (annual %)
2016,2015,2014,2013,2012,2011,2010,2009,2008,2007,2006,2005,2004,2003,2002,2001,2000,1999,1998,1997,1996,1995,1994,1993,1992,1991,1990,1989,1988,1987,1986,1985,1984,1983,1982,1981,1980,1979,1978,1977
This statistics in other country:
AfghanistanAlbaniaAlgeriaAndorraAngolaAntigua and BarbudaArab WorldArgentinaArmeniaArubaAustraliaAustriaAzerbaijanBahamas, TheBahrainBangladeshBarbadosBelarusBelgiumBelizeBeninBermudaBhutanBoliviaBosnia and HerzegovinaBotswanaBrazilBrunei DarussalamBulgariaBurkina FasoBurundiCabo VerdeCambodiaCameroonCanadaCaribbean small statesCayman IslandsCentral African RepublicCentral Europe and the BalticsChadChannel IslandsChileChinaColombiaComorosCongo, Dem. Rep.Congo, Rep.Costa RicaCote d'IvoireCroatiaCubaCyprusCzech RepublicDenmarkDjiboutiDominicaDominican RepublicEarly-demographic dividendEast Asia & PacificEast Asia & Pacific (excluding high income)East Asia & Pacific (IDA & IBRD countries)EcuadorEgypt, Arab Rep.El SalvadorEquatorial GuineaEritreaEstoniaEthiopiaEuro areaEurope & Central AsiaEurope & Central Asia (excluding high income)Europe & Central Asia (IDA & IBRD countries)European UnionFijiFinlandFragile and conflict affected situationsFranceFrench PolynesiaGabonGambia, TheGeorgiaGermanyGhanaGreeceGreenlandGrenadaGuatemalaGuineaGuinea-BissauGuyanaHaitiHeavily indebted poor countries (HIPC)High incomeHondurasHong Kong SAR, ChinaHungaryIBRD onlyIcelandIDA & IBRD totalIDA blendIDA onlyIDA totalIndiaIndonesiaIran, Islamic Rep.IraqIrelandIsle of ManIsraelItalyJamaicaJapanJordanKazakhstanKenyaKiribatiKorea, Rep.KosovoKuwaitKyrgyz RepublicLao PDRLate-demographic dividendLatin America & Caribbean Latin America & Caribbean (excluding high income)Latin America & the Caribbean (IDA & IBRD countries)LatviaLeast developed countries: UN classificationLebanonLesothoLiberiaLibyaLiechtensteinLithuaniaLow & middle incomeLow incomeLower middle incomeLuxembourgMacao SAR, ChinaMacedonia, FYRMadagascarMalawiMalaysiaMaldivesMaliMaltaMarshall IslandsMauritaniaMauritiusMexicoMicronesia, Fed. Sts.Middle East & North AfricaMiddle East & North Africa (excluding high income)Middle East & North Africa (IDA & IBRD countries)Middle incomeMoldovaMonacoMongoliaMontenegroMoroccoMozambiqueMyanmarNamibiaNauruNepalNetherlandsNew CaledoniaNew ZealandNicaraguaNigerNigeriaNorth AmericaNorwayOECD membersOmanOther small statesPacific island small statesPakistanPalauPanamaPapua New GuineaParaguayPeruPhilippinesPolandPortugalPost-demographic dividendPre-demographic dividendPuerto RicoQatarRomaniaRussian FederationRwandaSamoaSan MarinoSao Tome and PrincipeSaudi ArabiaSenegalSerbiaSeychellesSierra LeoneSingaporeSlovak RepublicSloveniaSmall statesSolomon IslandsSomaliaSouth AfricaSouth AsiaSouth Asia (IDA & IBRD)South SudanSpainSri LankaSt. Kitts and NevisSt. LuciaSt. Vincent and the GrenadinesSub-Saharan Africa Sub-Saharan Africa (excluding high income)Sub-Saharan Africa (IDA & IBRD countries)SudanSurinameSwazilandSwedenSwitzerlandSyrian Arab RepublicTajikistanTanzaniaThailandTimor-LesteTogoTongaTrinidad and TobagoTunisiaTurkeyTurkmenistanTuvaluUgandaUkraineUnited Arab EmiratesUnited KingdomUnited StatesUpper middle incomeUruguayUzbekistanVanuatuVenezuela, RBVietnamVirgin Islands (U.S.)West Bank and GazaWorldYemen, Rep.ZambiaZimbabwe Timeline:
This timeline shows a graph from 1977 to 2016 of Suriname. No data until 1976. Number of actual observations by date: 40.
Source name:
World Development Indicators
Source organization:
World Bank national accounts data, and OECD National Accounts data files.
Categories, topics:
Economy & Growth
Last updated:
apr 23, 2017
Indicators value changes by year
Minimum:
-15.716
jan 1, 1988
Maximum:
10.187
jan 1, 1978
At the date of observation
Value
Absolute change
Change from previous value
jan 1, 1977
-3.23
-3.23
0.0%
jan 1, 1978
10.187
+13.417
-415.42%
jan 1, 1979
7.491
-2.696
-26.46%
jan 1, 1980
-6.202
-13.693
-182.78%
jan 1, 1981
-5.369
+0.832
-13.42%
jan 1, 1982
0.108
+5.477
-102.01%
jan 1, 1983
-2.201
-2.309
-2.14K%
jan 1, 1984
-3.374
-1.173
53.27%
jan 1, 1985
-4.524
-1.15
34.07%
jan 1, 1986
-2.877
+1.646
-36.4%
jan 1, 1987
-4.954
-2.077
72.17%
jan 1, 1988
-15.716
-10.762
217.25%
jan 1, 1989
6.57
+22.286
-141.8%
jan 1, 1990
8.721
+2.151
32.74%
jan 1, 1991
-2.473
-11.194
-128.36%
jan 1, 1992
0.857
+3.331
-134.66%
jan 1, 1993
-1.969
-2.827
-329.75%
jan 1, 1994
-8.832
-6.863
348.45%
jan 1, 1995
1.509
+10.341
-117.08%
jan 1, 1996
-0.616
-2.124
-140.8%
jan 1, 1997
-0.472
+0.144
-23.31%
jan 1, 1998
3.923
+4.395
-931.08%
jan 1, 1999
-0.068
-3.991
-101.73%
jan 1, 2000
-2.232
-2.164
3.18K%
jan 1, 2001
-1.132
+1.1
-49.29%
jan 1, 2002
3.806
+4.938
-436.32%
jan 1, 2003
3.858
+0.052
1.36%
jan 1, 2004
5.712
+1.854
48.07%
jan 1, 2005
8.883
+3.171
55.5%
jan 1, 2006
4.0
-4.883
-54.97%
jan 1, 2007
3.014
-0.985
-24.64%
jan 1, 2008
4.062
+1.048
34.77%
jan 1, 2009
2.971
-1.091
-26.87%
jan 1, 2010
1.835
-1.136
-38.24%
jan 1, 2011
4.017
+2.182
118.92%
jan 1, 2012
4.202
+0.185
4.6%
jan 1, 2013
2.077
-2.124
-50.56%
jan 1, 2014
1.89
-0.187
-9.01%
jan 1, 2015
0.935
-0.955
-50.53%
jan 1, 2016
-1.168
-2.103
-224.9%
Ranking of countries by current statistics by years


Comments: