29
/
en
AIzaSyAYiBZKx7MnpbEhh9jyipgxe19OcubqV5w
April 1, 2024
222185
Peru
PER
true
2
1
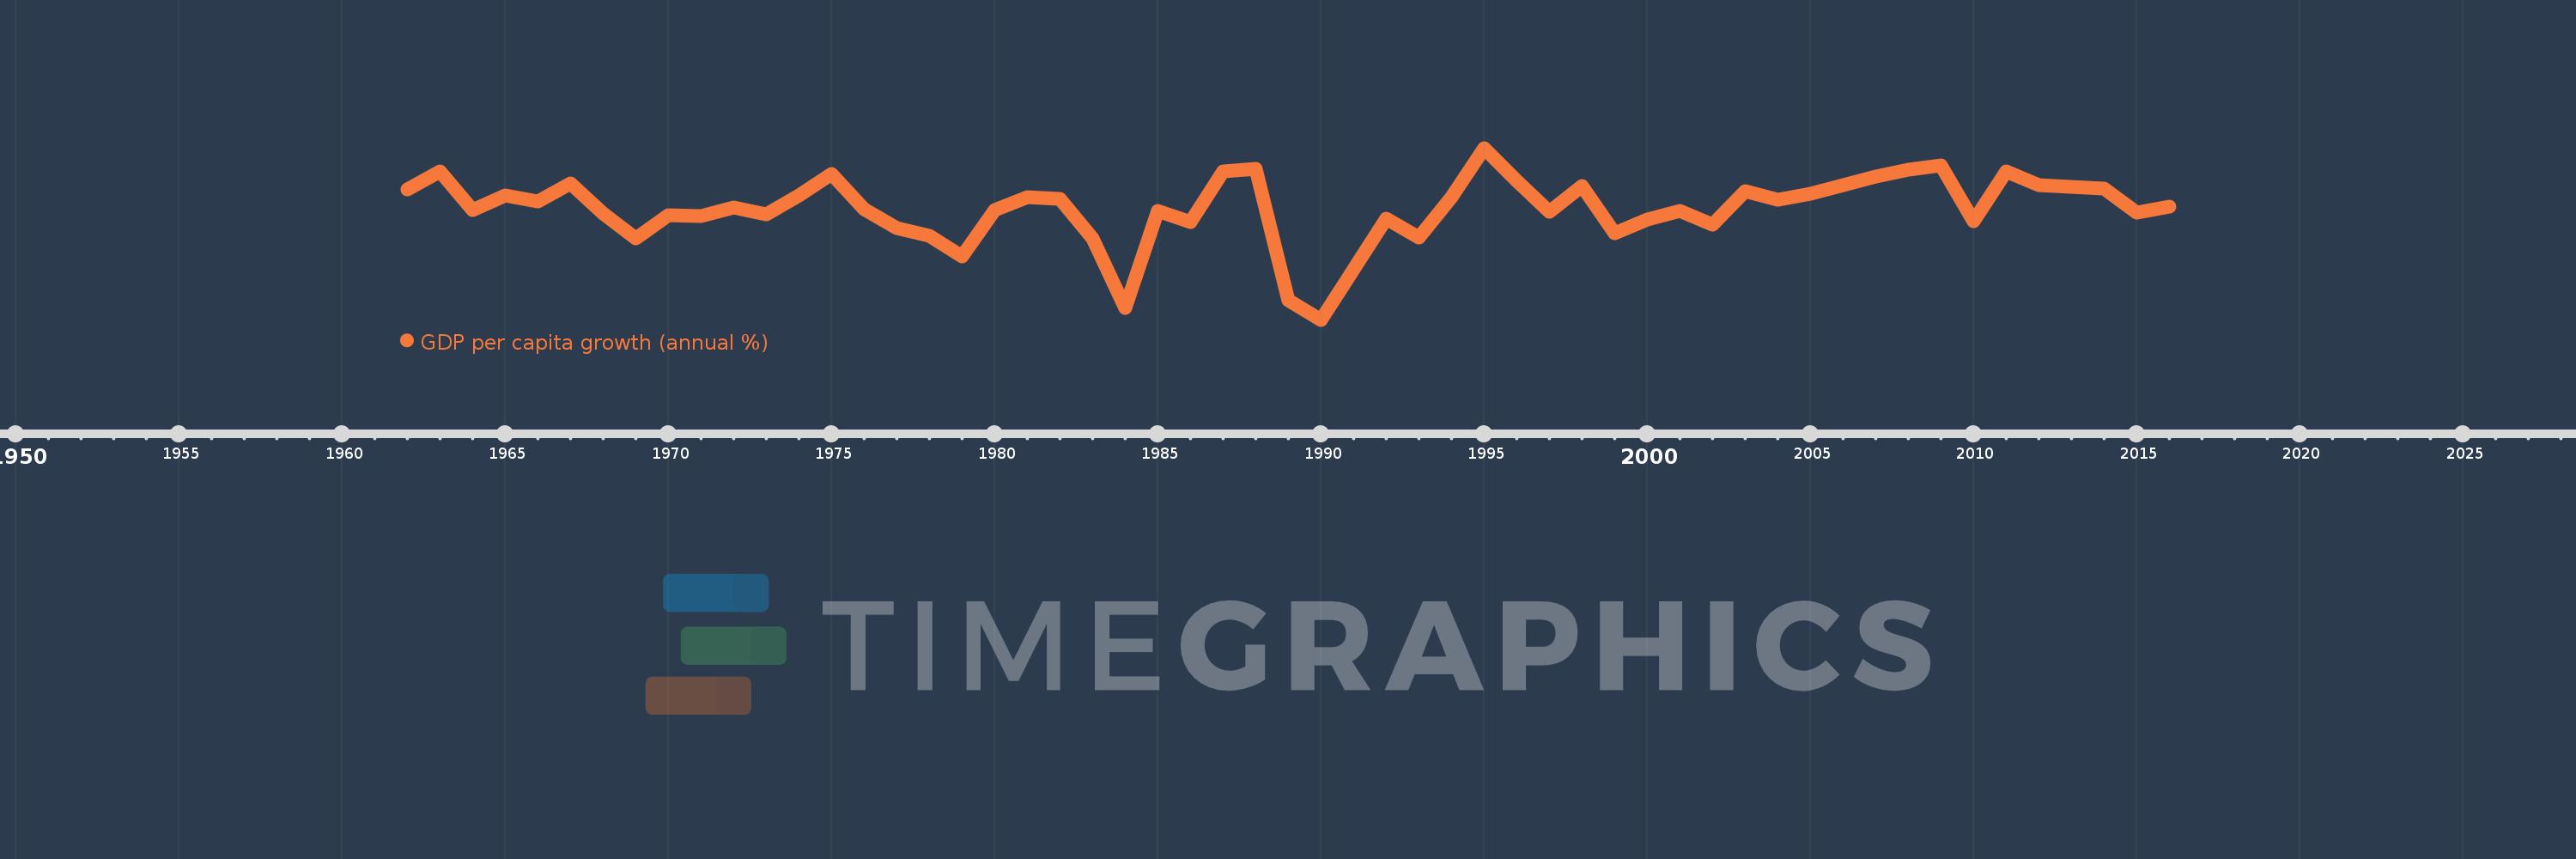
GDP per capita growth (annual %)
2016,2015,2014,2013,2012,2011,2010,2009,2008,2007,2006,2005,2004,2003,2002,2001,2000,1999,1998,1997,1996,1995,1994,1993,1992,1991,1990,1989,1988,1987,1986,1985,1984,1983,1982,1981,1980,1979,1978,1977,1976,1975,1974,1973,1972,1971,1970,1969,1968,1967,1966,1965,1964,1963,1962
This statistics in other country:
AfghanistanAlbaniaAlgeriaAndorraAngolaAntigua and BarbudaArab WorldArgentinaArmeniaArubaAustraliaAustriaAzerbaijanBahamas, TheBahrainBangladeshBarbadosBelarusBelgiumBelizeBeninBermudaBhutanBoliviaBosnia and HerzegovinaBotswanaBrazilBrunei DarussalamBulgariaBurkina FasoBurundiCabo VerdeCambodiaCameroonCanadaCaribbean small statesCayman IslandsCentral African RepublicCentral Europe and the BalticsChadChannel IslandsChileChinaColombiaComorosCongo, Dem. Rep.Congo, Rep.Costa RicaCote d'IvoireCroatiaCubaCyprusCzech RepublicDenmarkDjiboutiDominicaDominican RepublicEarly-demographic dividendEast Asia & PacificEast Asia & Pacific (excluding high income)East Asia & Pacific (IDA & IBRD countries)EcuadorEgypt, Arab Rep.El SalvadorEquatorial GuineaEritreaEstoniaEthiopiaEuro areaEurope & Central AsiaEurope & Central Asia (excluding high income)Europe & Central Asia (IDA & IBRD countries)European UnionFijiFinlandFragile and conflict affected situationsFranceFrench PolynesiaGabonGambia, TheGeorgiaGermanyGhanaGreeceGreenlandGrenadaGuatemalaGuineaGuinea-BissauGuyanaHaitiHeavily indebted poor countries (HIPC)High incomeHondurasHong Kong SAR, ChinaHungaryIBRD onlyIcelandIDA & IBRD totalIDA blendIDA onlyIDA totalIndiaIndonesiaIran, Islamic Rep.IraqIrelandIsle of ManIsraelItalyJamaicaJapanJordanKazakhstanKenyaKiribatiKorea, Rep.KosovoKuwaitKyrgyz RepublicLao PDRLate-demographic dividendLatin America & Caribbean Latin America & Caribbean (excluding high income)Latin America & the Caribbean (IDA & IBRD countries)LatviaLeast developed countries: UN classificationLebanonLesothoLiberiaLibyaLiechtensteinLithuaniaLow & middle incomeLow incomeLower middle incomeLuxembourgMacao SAR, ChinaMacedonia, FYRMadagascarMalawiMalaysiaMaldivesMaliMaltaMarshall IslandsMauritaniaMauritiusMexicoMicronesia, Fed. Sts.Middle East & North AfricaMiddle East & North Africa (excluding high income)Middle East & North Africa (IDA & IBRD countries)Middle incomeMoldovaMonacoMongoliaMontenegroMoroccoMozambiqueMyanmarNamibiaNauruNepalNetherlandsNew CaledoniaNew ZealandNicaraguaNigerNigeriaNorth AmericaNorwayOECD membersOmanOther small statesPacific island small statesPakistanPalauPanamaPapua New GuineaParaguayPeruPhilippinesPolandPortugalPost-demographic dividendPre-demographic dividendPuerto RicoQatarRomaniaRussian FederationRwandaSamoaSan MarinoSao Tome and PrincipeSaudi ArabiaSenegalSerbiaSeychellesSierra LeoneSingaporeSlovak RepublicSloveniaSmall statesSolomon IslandsSomaliaSouth AfricaSouth AsiaSouth Asia (IDA & IBRD)South SudanSpainSri LankaSt. Kitts and NevisSt. LuciaSt. Vincent and the GrenadinesSub-Saharan Africa Sub-Saharan Africa (excluding high income)Sub-Saharan Africa (IDA & IBRD countries)SudanSurinameSwazilandSwedenSwitzerlandSyrian Arab RepublicTajikistanTanzaniaThailandTimor-LesteTogoTongaTrinidad and TobagoTunisiaTurkeyTurkmenistanTuvaluUgandaUkraineUnited Arab EmiratesUnited KingdomUnited StatesUpper middle incomeUruguayUzbekistanVanuatuVenezuela, RBVietnamVirgin Islands (U.S.)West Bank and GazaWorldYemen, Rep.ZambiaZimbabwe Timeline:
This timeline shows a graph from 1962 to 2016 of Peru. No data until 1961. Number of actual observations by date: 55.
Source name:
World Development Indicators
Source organization:
World Bank national accounts data, and OECD National Accounts data files.
Categories, topics:
Economy & Growth
Last updated:
apr 23, 2017
Indicators value changes by year
Minimum:
-14.195
jan 1, 1990
Maximum:
10.239
jan 1, 1995
At the date of observation
Value
Absolute change
Change from previous value
jan 1, 1962
4.353
+4.353
0.0%
jan 1, 1963
6.931
+2.579
59.25%
jan 1, 1964
1.37
-5.562
-80.24%
jan 1, 1965
3.53
+2.161
157.79%
jan 1, 1966
2.649
-0.881
-24.96%
jan 1, 1967
5.215
+2.565
96.84%
jan 1, 1968
0.971
-4.243
-81.37%
jan 1, 1969
-2.602
-3.573
-367.84%
jan 1, 1970
0.699
+3.3
-126.87%
jan 1, 1971
0.587
-0.112
-15.97%
jan 1, 1972
1.818
+1.231
209.57%
jan 1, 1973
0.771
-1.048
-57.62%
jan 1, 1974
3.517
+2.747
356.47%
jan 1, 1975
6.546
+3.029
86.12%
jan 1, 1976
1.581
-4.965
-75.84%
jan 1, 1977
-1.212
-2.793
-176.65%
jan 1, 1978
-2.284
-1.072
88.45%
jan 1, 1979
-5.18
-2.896
126.78%
jan 1, 1980
1.424
+6.603
-127.48%
jan 1, 1981
3.292
+1.869
131.28%
jan 1, 1982
2.981
-0.312
-9.47%
jan 1, 1983
-2.594
-5.575
-187.03%
jan 1, 1984
-12.495
-9.901
381.67%
jan 1, 1985
1.226
+13.721
-109.81%
jan 1, 1986
-0.265
-1.491
-121.58%
jan 1, 1987
6.956
+7.221
-2.73K%
jan 1, 1988
7.283
+0.326
4.69%
jan 1, 1989
-11.426
-18.708
-256.89%
jan 1, 1990
-14.195
-2.77
24.24%
jan 1, 1991
-6.976
+7.22
-50.86%
jan 1, 1992
0.125
+7.101
-101.8%
jan 1, 1993
-2.526
-2.651
-2.12K%
jan 1, 1994
3.214
+5.74
-227.22%
jan 1, 1995
10.239
+7.026
218.62%
jan 1, 1996
5.537
-4.702
-45.92%
jan 1, 1997
1.107
-4.431
-80.01%
jan 1, 1998
4.82
+3.713
335.47%
jan 1, 1999
-1.863
-6.683
-138.66%
jan 1, 2000
0.059
+1.923
-103.18%
jan 1, 2001
1.293
+1.234
2.08K%
jan 1, 2002
-0.71
-2.003
-154.87%
jan 1, 2003
4.105
+4.815
-678.5%
jan 1, 2004
2.865
-1.241
-30.22%
jan 1, 2005
3.667
+0.803
28.02%
jan 1, 2006
4.987
+1.32
35.99%
jan 1, 2007
6.223
+1.236
24.78%
jan 1, 2008
7.204
+0.981
15.76%
jan 1, 2009
7.796
+0.592
8.22%
jan 1, 2010
-0.157
-7.953
-102.02%
jan 1, 2011
6.96
+7.118
-4.52K%
jan 1, 2012
4.947
-2.013
-28.92%
jan 1, 2013
4.736
-0.211
-4.27%
jan 1, 2014
4.444
-0.292
-6.16%
jan 1, 2015
1.007
-3.437
-77.34%
jan 1, 2016
1.923
+0.916
90.98%
Ranking of countries by current statistics by years


Comments: