29
/
en
AIzaSyAYiBZKx7MnpbEhh9jyipgxe19OcubqV5w
April 1, 2024
133145
Finland
FIN
true
2
1
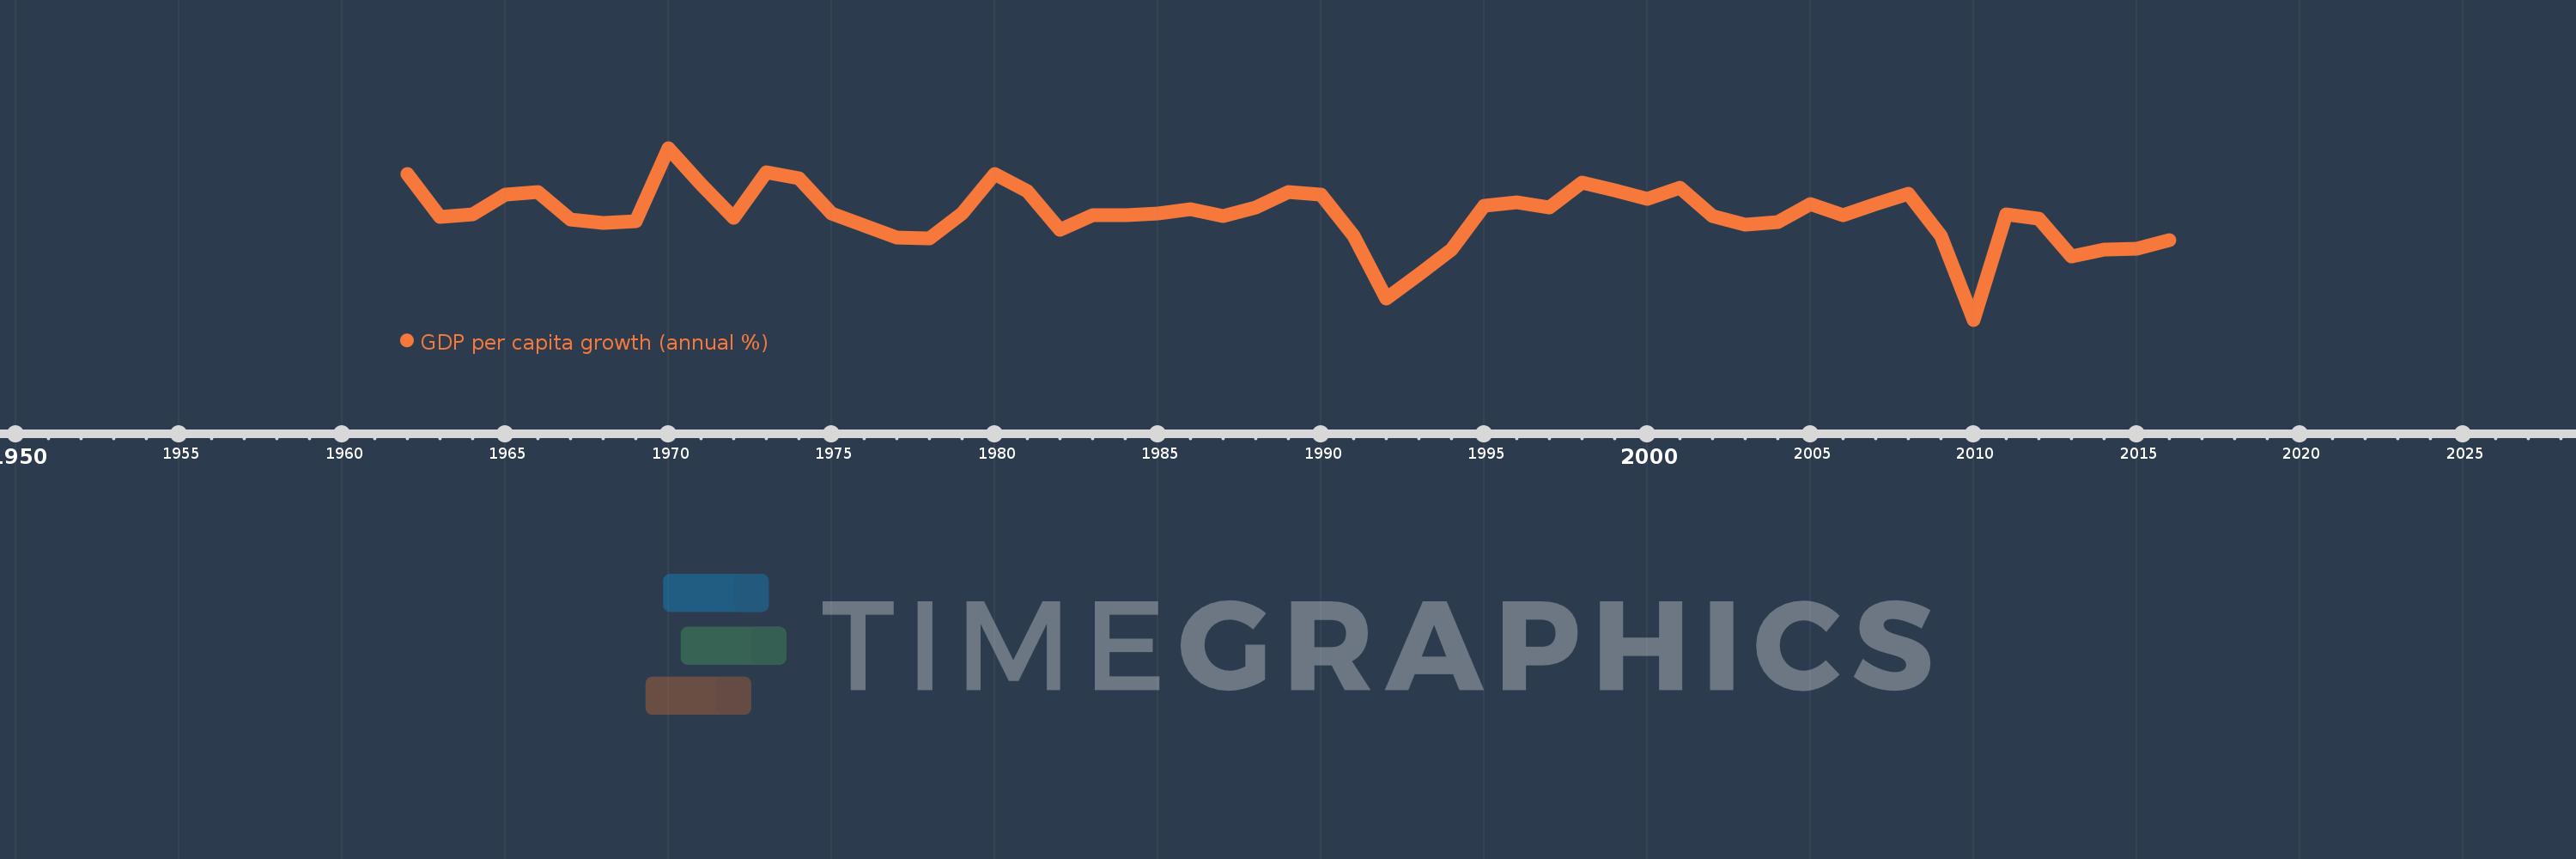
GDP per capita growth (annual %)
2016,2015,2014,2013,2012,2011,2010,2009,2008,2007,2006,2005,2004,2003,2002,2001,2000,1999,1998,1997,1996,1995,1994,1993,1992,1991,1990,1989,1988,1987,1986,1985,1984,1983,1982,1981,1980,1979,1978,1977,1976,1975,1974,1973,1972,1971,1970,1969,1968,1967,1966,1965,1964,1963,1962
This statistics in other country:
AfghanistanAlbaniaAlgeriaAndorraAngolaAntigua and BarbudaArab WorldArgentinaArmeniaArubaAustraliaAustriaAzerbaijanBahamas, TheBahrainBangladeshBarbadosBelarusBelgiumBelizeBeninBermudaBhutanBoliviaBosnia and HerzegovinaBotswanaBrazilBrunei DarussalamBulgariaBurkina FasoBurundiCabo VerdeCambodiaCameroonCanadaCaribbean small statesCayman IslandsCentral African RepublicCentral Europe and the BalticsChadChannel IslandsChileChinaColombiaComorosCongo, Dem. Rep.Congo, Rep.Costa RicaCote d'IvoireCroatiaCubaCyprusCzech RepublicDenmarkDjiboutiDominicaDominican RepublicEarly-demographic dividendEast Asia & PacificEast Asia & Pacific (excluding high income)East Asia & Pacific (IDA & IBRD countries)EcuadorEgypt, Arab Rep.El SalvadorEquatorial GuineaEritreaEstoniaEthiopiaEuro areaEurope & Central AsiaEurope & Central Asia (excluding high income)Europe & Central Asia (IDA & IBRD countries)European UnionFijiFinlandFragile and conflict affected situationsFranceFrench PolynesiaGabonGambia, TheGeorgiaGermanyGhanaGreeceGreenlandGrenadaGuatemalaGuineaGuinea-BissauGuyanaHaitiHeavily indebted poor countries (HIPC)High incomeHondurasHong Kong SAR, ChinaHungaryIBRD onlyIcelandIDA & IBRD totalIDA blendIDA onlyIDA totalIndiaIndonesiaIran, Islamic Rep.IraqIrelandIsle of ManIsraelItalyJamaicaJapanJordanKazakhstanKenyaKiribatiKorea, Rep.KosovoKuwaitKyrgyz RepublicLao PDRLate-demographic dividendLatin America & Caribbean Latin America & Caribbean (excluding high income)Latin America & the Caribbean (IDA & IBRD countries)LatviaLeast developed countries: UN classificationLebanonLesothoLiberiaLibyaLiechtensteinLithuaniaLow & middle incomeLow incomeLower middle incomeLuxembourgMacao SAR, ChinaMacedonia, FYRMadagascarMalawiMalaysiaMaldivesMaliMaltaMarshall IslandsMauritaniaMauritiusMexicoMicronesia, Fed. Sts.Middle East & North AfricaMiddle East & North Africa (excluding high income)Middle East & North Africa (IDA & IBRD countries)Middle incomeMoldovaMonacoMongoliaMontenegroMoroccoMozambiqueMyanmarNamibiaNauruNepalNetherlandsNew CaledoniaNew ZealandNicaraguaNigerNigeriaNorth AmericaNorwayOECD membersOmanOther small statesPacific island small statesPakistanPalauPanamaPapua New GuineaParaguayPeruPhilippinesPolandPortugalPost-demographic dividendPre-demographic dividendPuerto RicoQatarRomaniaRussian FederationRwandaSamoaSan MarinoSao Tome and PrincipeSaudi ArabiaSenegalSerbiaSeychellesSierra LeoneSingaporeSlovak RepublicSloveniaSmall statesSolomon IslandsSomaliaSouth AfricaSouth AsiaSouth Asia (IDA & IBRD)South SudanSpainSri LankaSt. Kitts and NevisSt. LuciaSt. Vincent and the GrenadinesSub-Saharan Africa Sub-Saharan Africa (excluding high income)Sub-Saharan Africa (IDA & IBRD countries)SudanSurinameSwazilandSwedenSwitzerlandSyrian Arab RepublicTajikistanTanzaniaThailandTimor-LesteTogoTongaTrinidad and TobagoTunisiaTurkeyTurkmenistanTuvaluUgandaUkraineUnited Arab EmiratesUnited KingdomUnited StatesUpper middle incomeUruguayUzbekistanVanuatuVenezuela, RBVietnamVirgin Islands (U.S.)West Bank and GazaWorldYemen, Rep.ZambiaZimbabwe Timeline:
This timeline shows a graph from 1962 to 2016 of Finland. No data until 1961. Number of actual observations by date: 55.
Source name:
World Development Indicators
Source organization:
World Bank national accounts data, and OECD National Accounts data files.
Categories, topics:
Economy & Growth
Last updated:
apr 23, 2017
Indicators value changes by year
Minimum:
-8.707
jan 1, 2010
At the date of observation
Value
Absolute change
Change from previous value
jan 1, 1962
6.848
+6.848
0.0%
jan 1, 1963
2.284
-4.564
-66.65%
jan 1, 1964
2.557
+0.273
11.97%
jan 1, 1965
4.655
+2.097
82.01%
jan 1, 1966
4.952
+0.298
6.39%
jan 1, 1967
1.99
-2.963
-59.82%
jan 1, 1968
1.617
-0.373
-18.74%
jan 1, 1969
1.845
+0.228
14.1%
jan 1, 1970
9.657
+7.812
423.41%
jan 1, 1971
5.734
-3.923
-40.63%
jan 1, 1972
2.228
-3.506
-61.14%
jan 1, 1973
7.096
+4.868
218.52%
jan 1, 1974
6.378
-0.718
-10.12%
jan 1, 1975
2.697
-3.681
-57.71%
jan 1, 1976
1.354
-1.343
-49.8%
jan 1, 1977
0.042
-1.312
-96.87%
jan 1, 1978
-0.041
-0.083
-195.64%
jan 1, 1979
2.625
+2.665
-6.58K%
jan 1, 1980
6.848
+4.224
160.93%
jan 1, 1981
5.062
-1.787
-26.09%
jan 1, 1982
0.864
-4.198
-82.94%
jan 1, 1983
2.511
+1.648
190.79%
jan 1, 1984
2.508
-0.003
-0.12%
jan 1, 1985
2.664
+0.156
6.21%
jan 1, 1986
3.106
+0.442
16.58%
jan 1, 1987
2.393
-0.713
-22.95%
jan 1, 1988
3.266
+0.873
36.47%
jan 1, 1989
4.904
+1.639
50.18%
jan 1, 1990
4.709
-0.195
-3.99%
jan 1, 1991
0.23
-4.479
-95.11%
jan 1, 1992
-6.427
-6.657
-2.89K%
jan 1, 1993
-3.866
+2.561
-39.84%
jan 1, 1994
-1.214
+2.653
-68.61%
jan 1, 1995
3.492
+4.706
-387.75%
jan 1, 1996
3.81
+0.318
9.11%
jan 1, 1997
3.319
-0.491
-12.88%
jan 1, 1998
5.936
+2.617
78.84%
jan 1, 1999
5.149
-0.787
-13.26%
jan 1, 2000
4.202
-0.947
-18.39%
jan 1, 2001
5.416
+1.214
28.89%
jan 1, 2002
2.347
-3.068
-56.65%
jan 1, 2003
1.434
-0.913
-38.91%
jan 1, 2004
1.751
+0.317
22.1%
jan 1, 2005
3.625
+1.874
107.0%
jan 1, 2006
2.429
-1.196
-32.99%
jan 1, 2007
3.657
+1.228
50.55%
jan 1, 2008
4.738
+1.082
29.58%
jan 1, 2009
0.253
-4.485
-94.66%
jan 1, 2010
-8.707
-8.96
-3.54K%
jan 1, 2011
2.522
+11.229
-128.97%
jan 1, 2012
2.096
-0.426
-16.88%
jan 1, 2013
-1.894
-3.991
-190.35%
jan 1, 2014
-1.214
+0.68
-35.89%
jan 1, 2015
-1.118
+0.096
-7.91%
jan 1, 2016
-0.164
+0.954
-85.29%
Ranking of countries by current statistics by years


Comments: