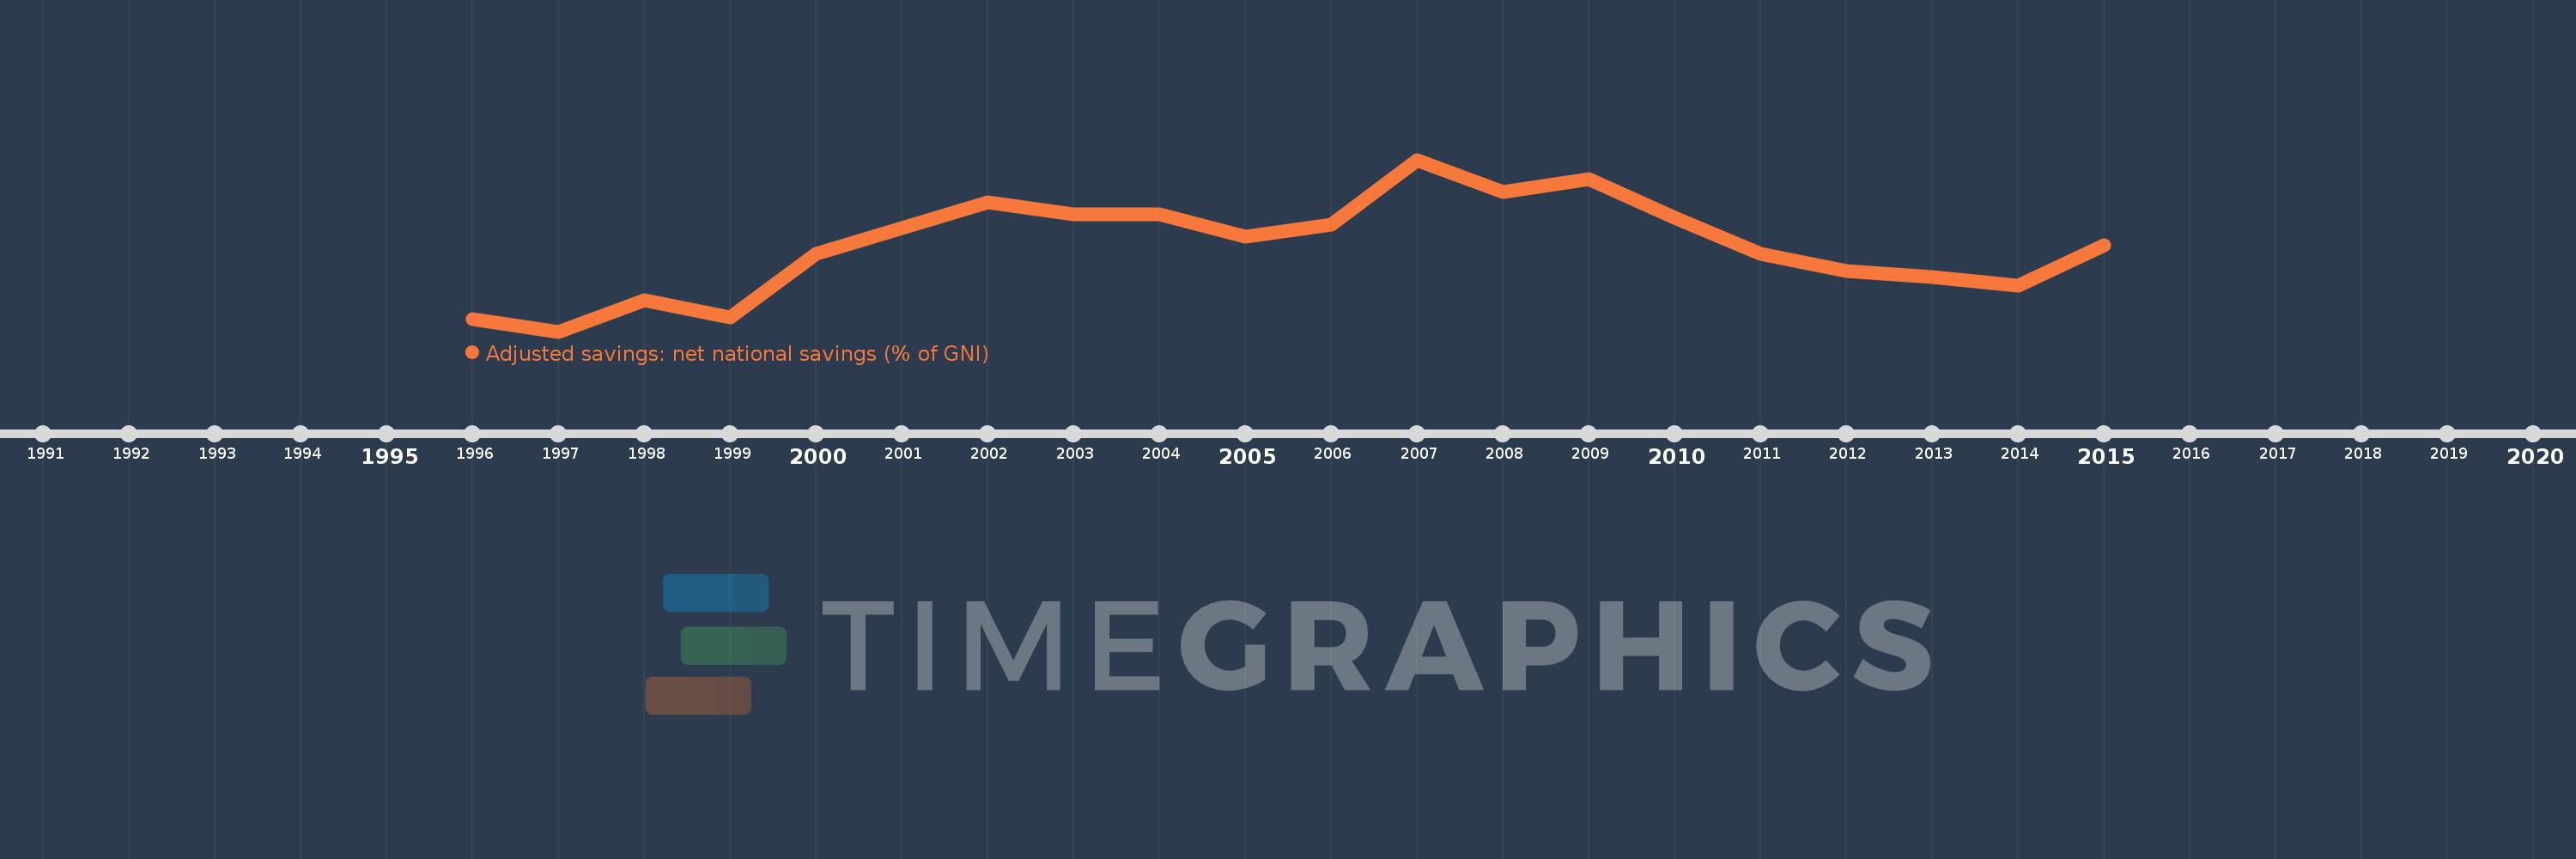
This timeline shows a graph from 1996 to 2015 of Cambodia. No data until 1995. Number of actual observations by date: 20.
Source name:
World Development Indicators
Source organization:
World Bank staff estimates based on sources and methods in World Bank's "The Changing Wealth of Nations: Measuring Sustainable Development in the New Millennium" (2011).
Categories, topics:
Economy & Growth, Environment
Last updated:
apr 23, 2017
Indicators value changes by year
Meaning:
4.825
Minimum:
-3.202
jan 1, 1997
Maximum:
12.936
jan 1, 2007
At the date of observation
Value
Absolute change
Change from the previous value
jan 1, 1996
-2.037
-2.037
0.0%
jan 1, 1997
-3.202
-1.166
57.24%
jan 1, 1998
-0.24
+2.962
-92.51%
jan 1, 1999
-1.861
-1.621
675.98%
jan 1, 2000
4.128
+5.989
-321.81%
jan 1, 2001
6.535
+2.407
58.3%
jan 1, 2002
8.942
+2.408
36.84%
jan 1, 2003
7.777
-1.165
-13.03%
jan 1, 2004
7.806
+0.028
0.37%
jan 1, 2005
5.741
-2.065
-26.45%
jan 1, 2006
6.821
+1.08
18.8%
jan 1, 2007
12.936
+6.116
89.67%
jan 1, 2008
9.911
-3.025
-23.38%
jan 1, 2009
11.157
+1.245
12.57%
jan 1, 2010
7.452
-3.705
-33.2%
jan 1, 2011
4.116
-3.336
-44.76%
jan 1, 2012
2.492
-1.624
-39.45%
jan 1, 2013
1.96
-0.532
-21.35%
jan 1, 2014
1.137
-0.824
-42.02%
jan 1, 2015
4.934
+3.798
334.11%
Ranking of countries by current statistics by years