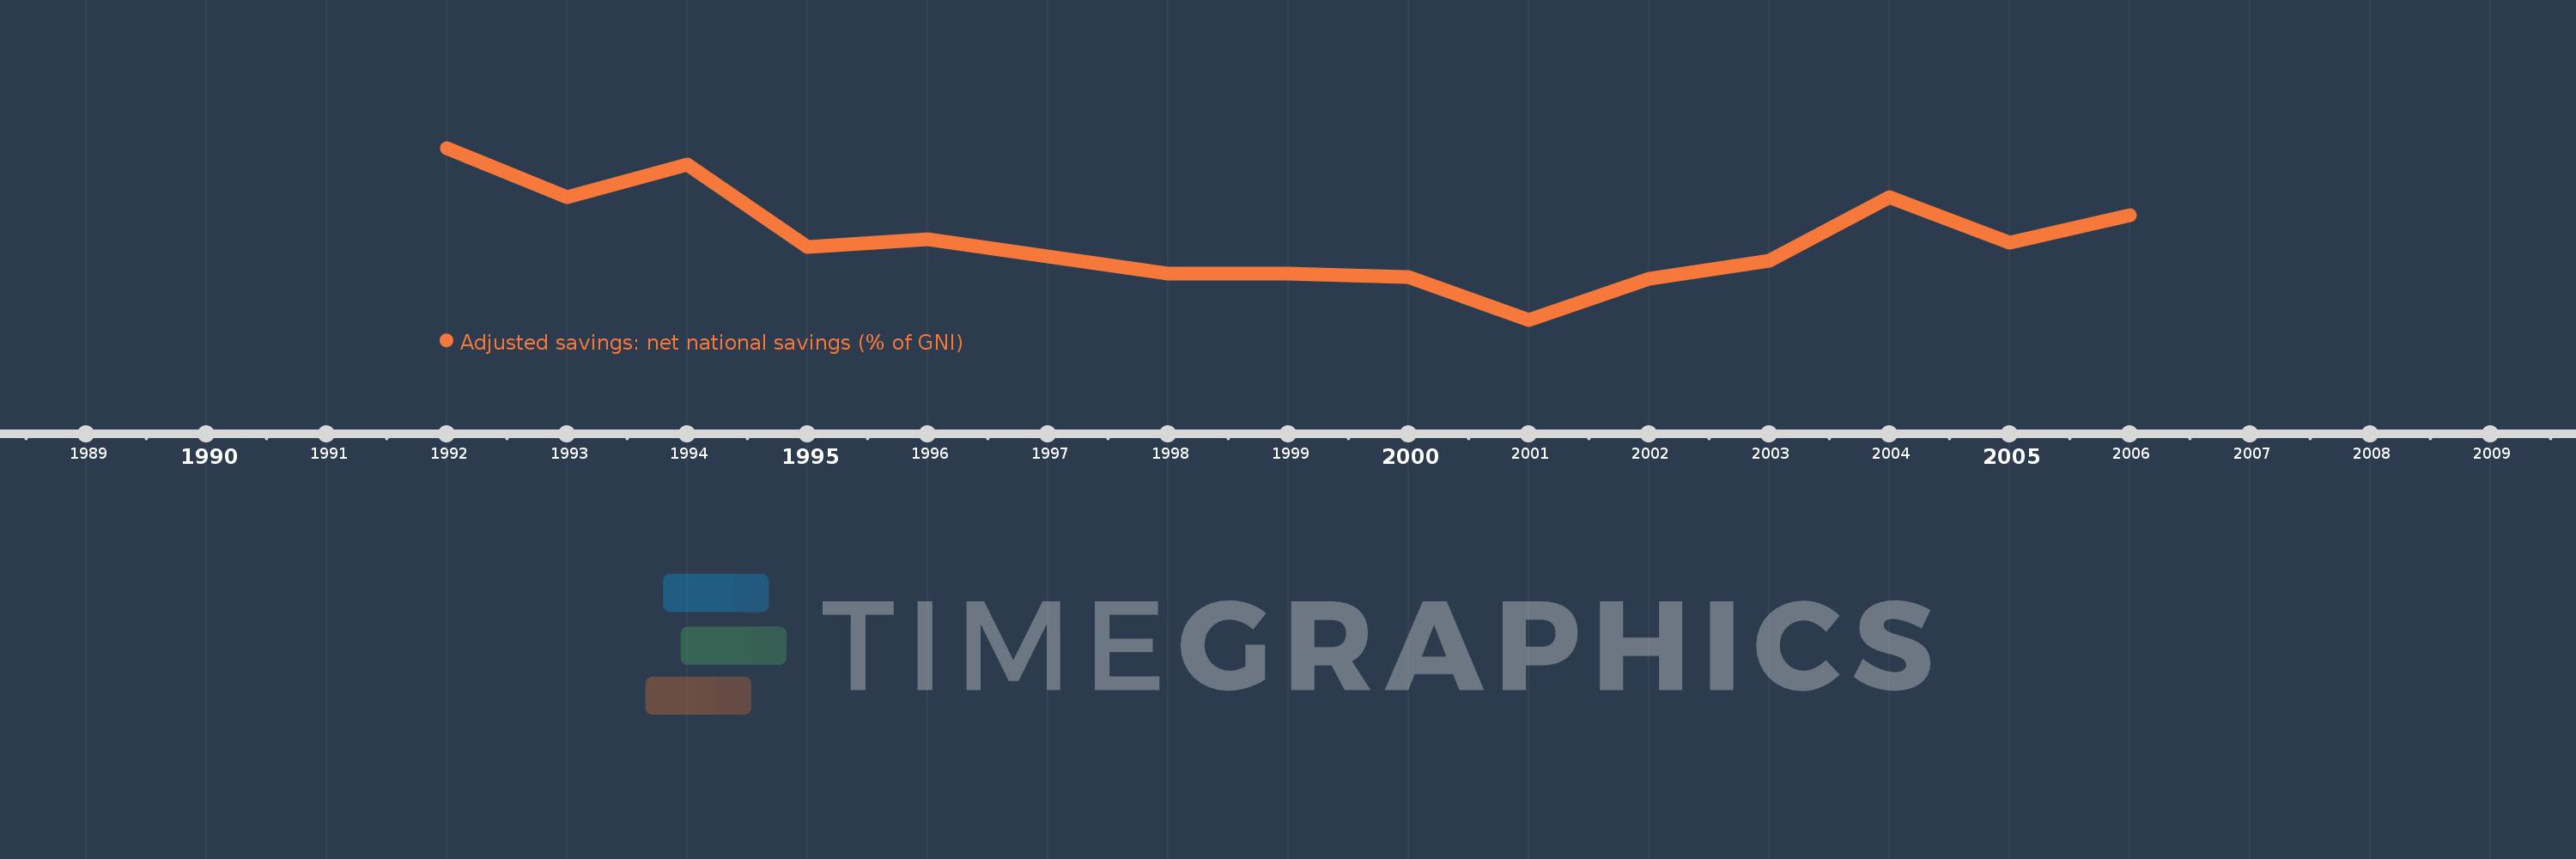
This timeline shows a graph from 1992 to 2006 of Djibouti. No data until 1991. Number of actual observations by date: 15.
Source name:
World Development Indicators
Source organization:
World Bank staff estimates based on sources and methods in World Bank's "The Changing Wealth of Nations: Measuring Sustainable Development in the New Millennium" (2011).
Categories, topics:
Economy & Growth, Environment
Last updated:
apr 23, 2017
Indicators value changes by year
Meaning:
13.578
Minimum:
2.401
jan 1, 2001
Maximum:
26.307
jan 1, 1992
At the date of observation
Value
Absolute change
Change from the previous value
jan 1, 1992
26.307
+26.307
0.0%
jan 1, 1993
19.456
-6.851
-26.04%
jan 1, 1994
23.956
+4.5
23.13%
jan 1, 1995
12.583
-11.373
-47.47%
jan 1, 1996
13.572
+0.989
7.86%
jan 1, 1997
11.266
-2.306
-16.99%
jan 1, 1998
8.841
-2.425
-21.52%
jan 1, 1999
8.778
-0.063
-0.71%
jan 1, 2000
8.321
-0.457
-5.21%
jan 1, 2001
2.401
-5.92
-71.14%
jan 1, 2002
8.048
+5.647
235.14%
jan 1, 2003
10.654
+2.606
32.38%
jan 1, 2004
19.453
+8.799
82.59%
jan 1, 2005
13.119
-6.334
-32.56%
jan 1, 2006
16.914
+3.795
28.93%
Ranking of countries by current statistics by years