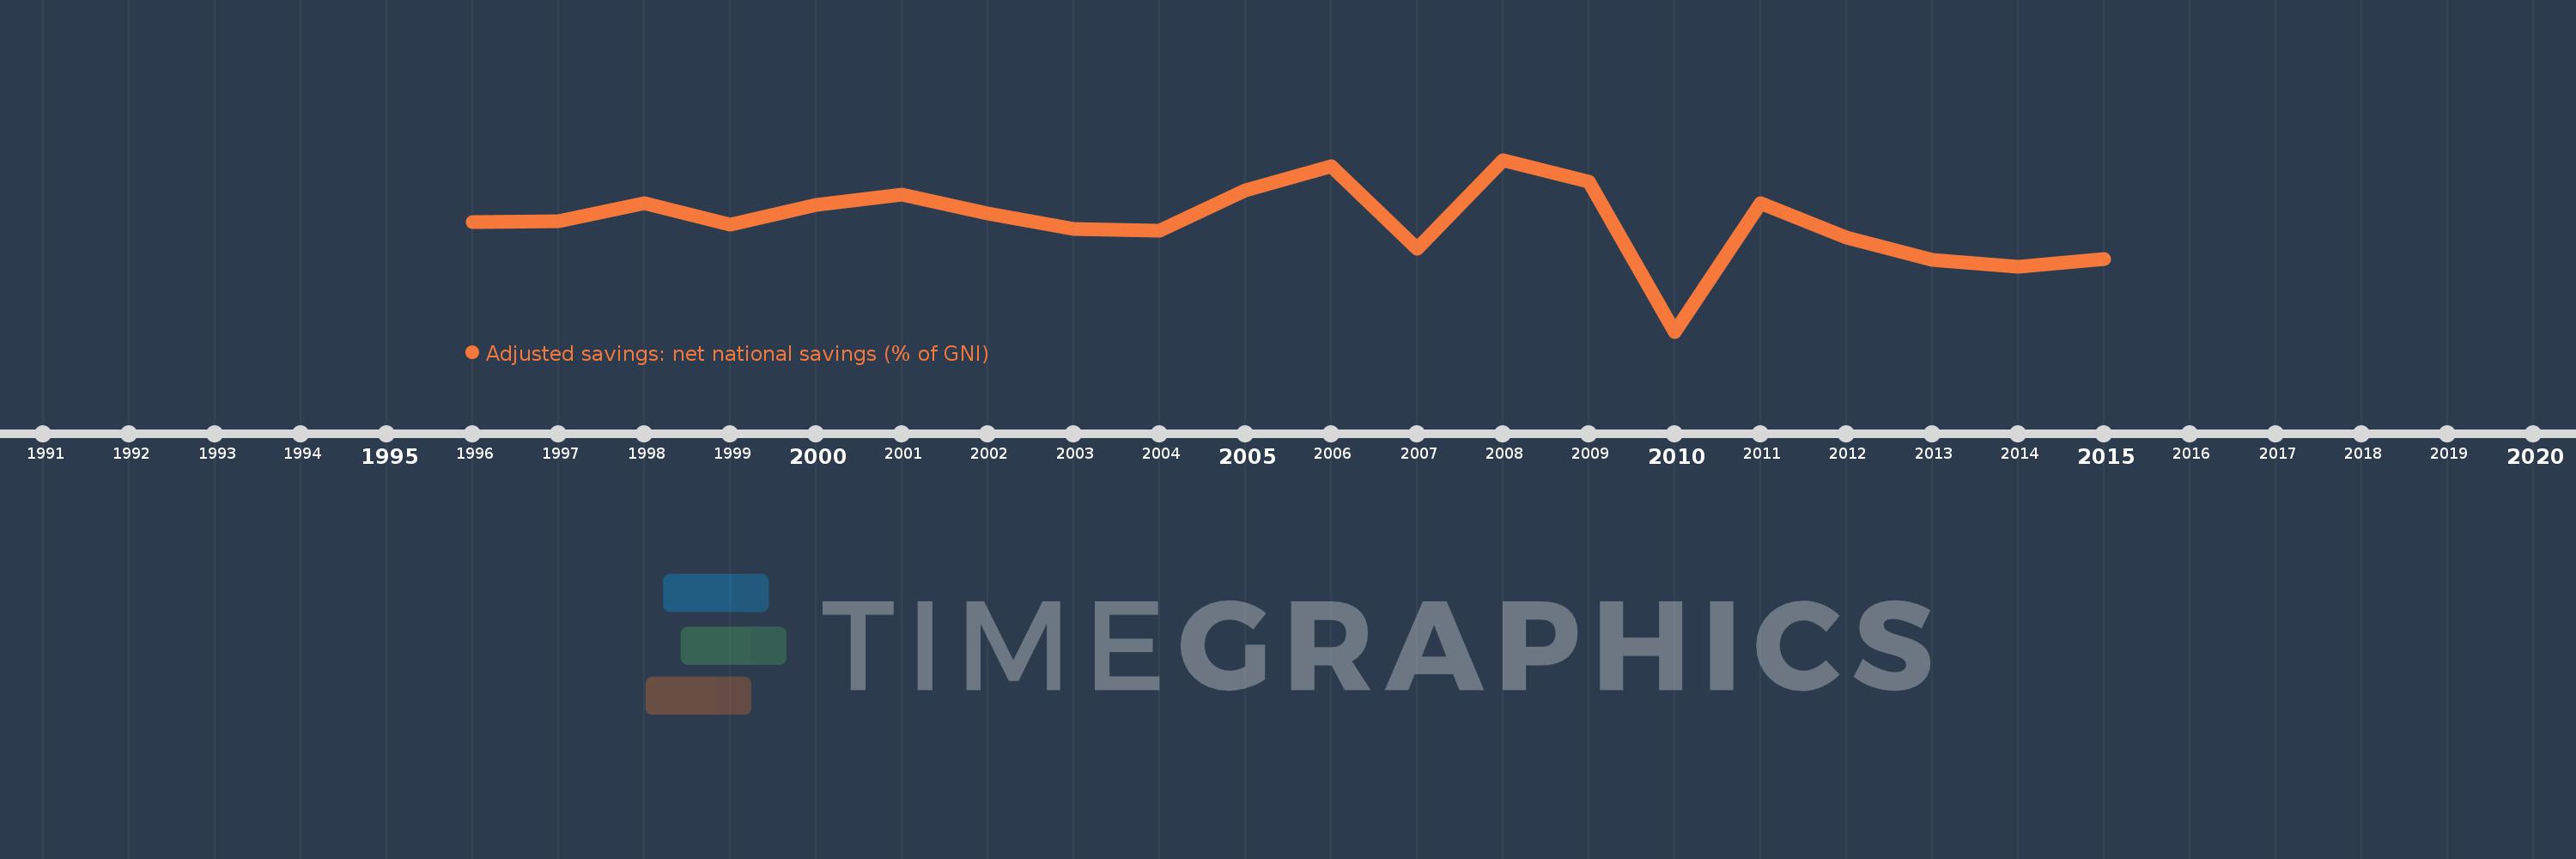
This timeline shows a graph from 1996 to 2015 of Luxembourg. No data until 1995. Number of actual observations by date: 20.
Source name:
World Development Indicators
Source organization:
World Bank staff estimates based on sources and methods in World Bank's "The Changing Wealth of Nations: Measuring Sustainable Development in the New Millennium" (2011).
Categories, topics:
Economy & Growth, Environment
Last updated:
apr 23, 2017
Indicators value changes by year
Meaning:
13.78
Minimum:
-0.085
jan 1, 2010
Maximum:
21.744
jan 1, 2008
At the date of observation
Value
Absolute change
Change from the previous value
jan 1, 1996
13.798
+13.798
0.0%
jan 1, 1997
13.953
+0.155
1.13%
jan 1, 1998
16.231
+2.278
16.32%
jan 1, 1999
13.515
-2.716
-16.73%
jan 1, 2000
15.982
+2.467
18.25%
jan 1, 2001
17.28
+1.298
8.12%
jan 1, 2002
14.912
-2.368
-13.7%
jan 1, 2003
13.01
-1.902
-12.76%
jan 1, 2004
12.72
-0.29
-2.23%
jan 1, 2005
17.899
+5.179
40.72%
jan 1, 2006
20.95
+3.051
17.05%
jan 1, 2007
10.459
-10.491
-50.08%
jan 1, 2008
21.744
+11.286
107.91%
jan 1, 2009
18.908
-2.836
-13.04%
jan 1, 2010
-0.085
-18.993
-100.45%
jan 1, 2011
16.204
+16.289
-19.09K%
jan 1, 2012
11.87
-4.334
-26.75%
jan 1, 2013
8.989
-2.88
-24.27%
jan 1, 2014
8.187
-0.802
-8.93%
jan 1, 2015
9.085
+0.898
10.97%
Ranking of countries by current statistics by years