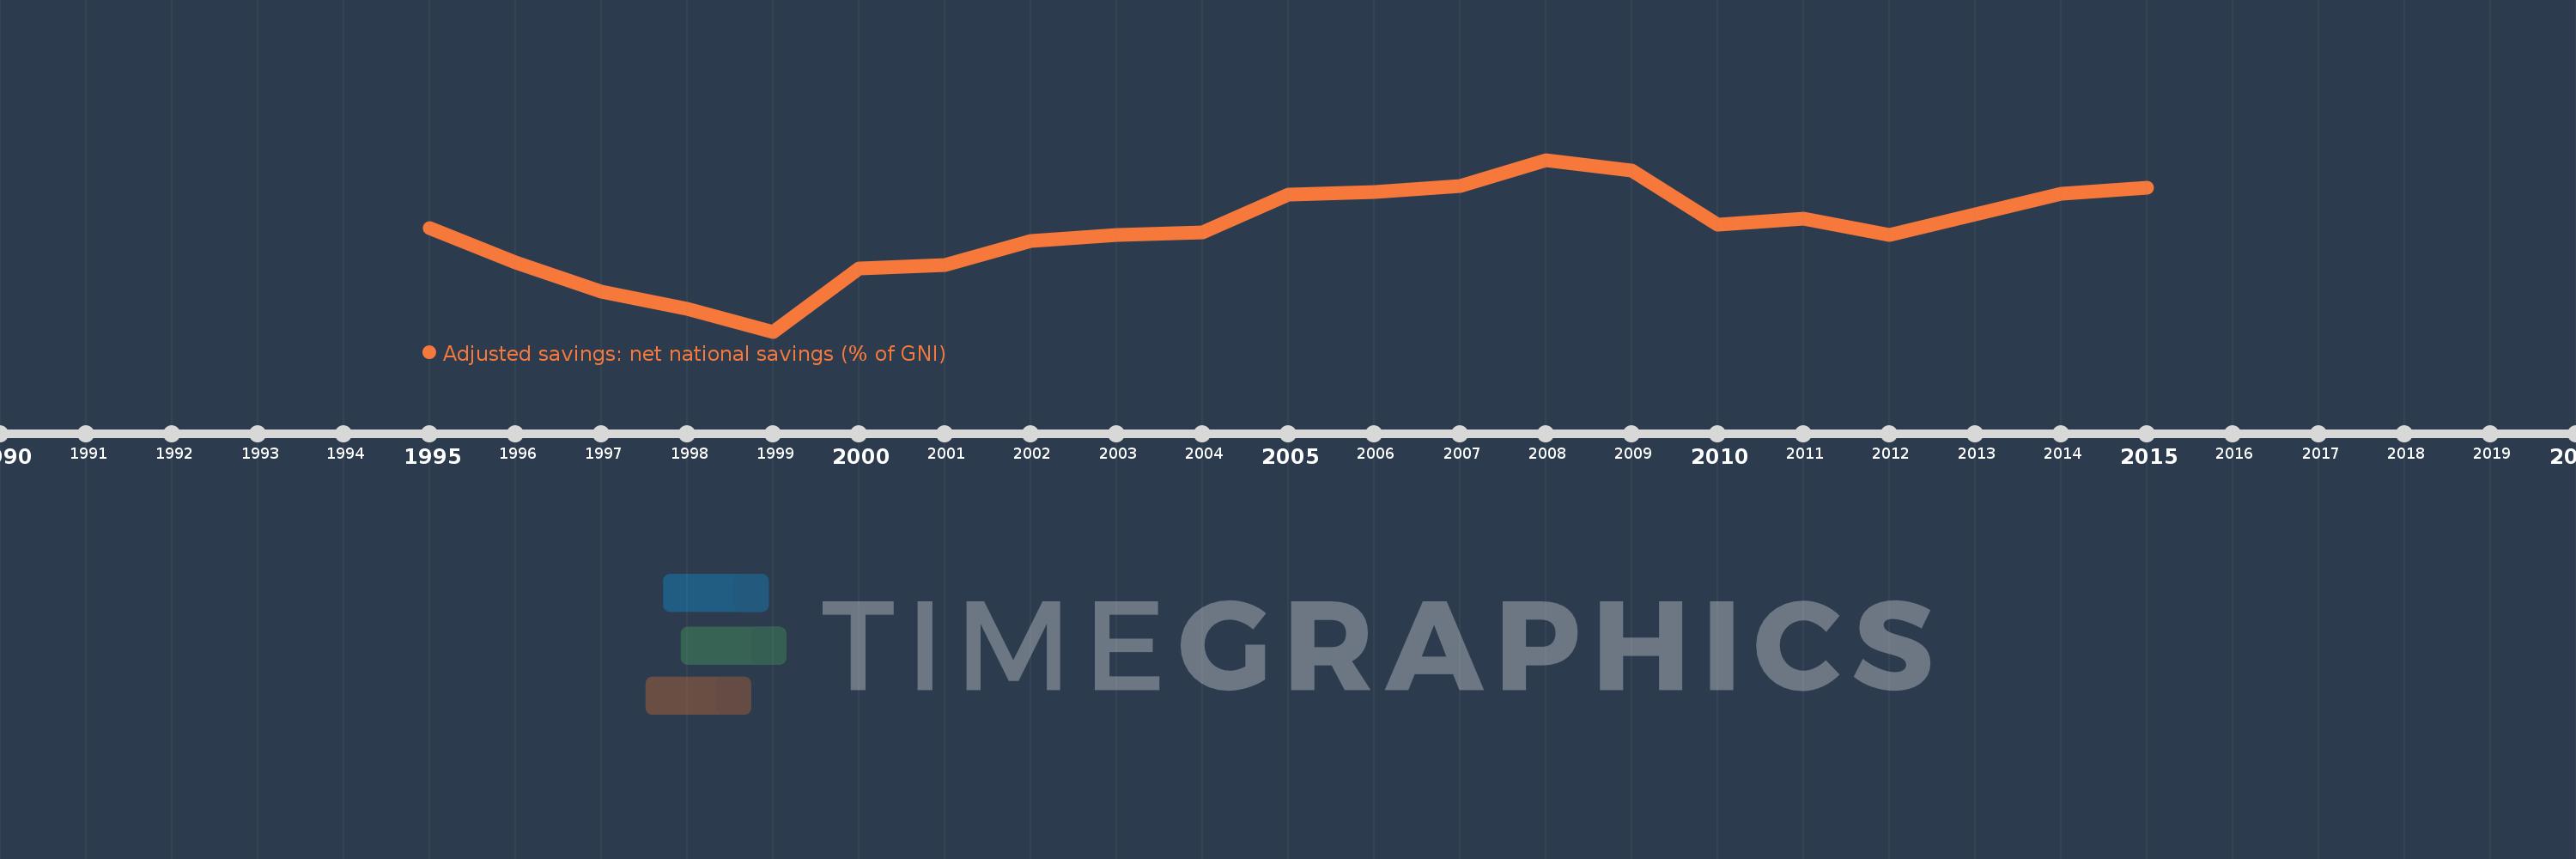
This timeline shows a graph from 1995 to 2015 of Moldova. No data until 1994. Number of actual observations by date: 21.
Source name:
World Development Indicators
Source organization:
World Bank staff estimates based on sources and methods in World Bank's "The Changing Wealth of Nations: Measuring Sustainable Development in the New Millennium" (2011).
Categories, topics:
Economy & Growth, Environment
Last updated:
apr 23, 2017
Indicators value changes by year
Meaning:
2.482
Minimum:
-13.615
jan 1, 1999
Maximum:
13.739
jan 1, 2008
At the date of observation
Value
Absolute change
Change from the previous value
jan 1, 1995
2.92
+2.92
0.0%
jan 1, 1996
-2.673
-5.593
-191.54%
jan 1, 1997
-7.258
-4.585
171.55%
jan 1, 1998
-9.955
-2.696
37.15%
jan 1, 1999
-13.615
-3.661
36.78%
jan 1, 2000
-3.497
+10.119
-74.32%
jan 1, 2001
-2.998
+0.498
-14.25%
jan 1, 2002
0.795
+3.794
-126.53%
jan 1, 2003
1.812
+1.016
127.79%
jan 1, 2004
2.161
+0.349
19.28%
jan 1, 2005
8.206
+6.044
279.65%
jan 1, 2006
8.651
+0.445
5.43%
jan 1, 2007
9.511
+0.86
9.94%
jan 1, 2008
13.739
+4.228
44.45%
jan 1, 2009
12.055
-1.684
-12.26%
jan 1, 2010
3.35
-8.706
-72.21%
jan 1, 2011
4.397
+1.047
31.25%
jan 1, 2012
1.729
-2.668
-60.67%
jan 1, 2013
5.095
+3.366
194.65%
jan 1, 2014
8.378
+3.283
64.43%
jan 1, 2015
9.326
+0.948
11.31%
Ranking of countries by current statistics by years