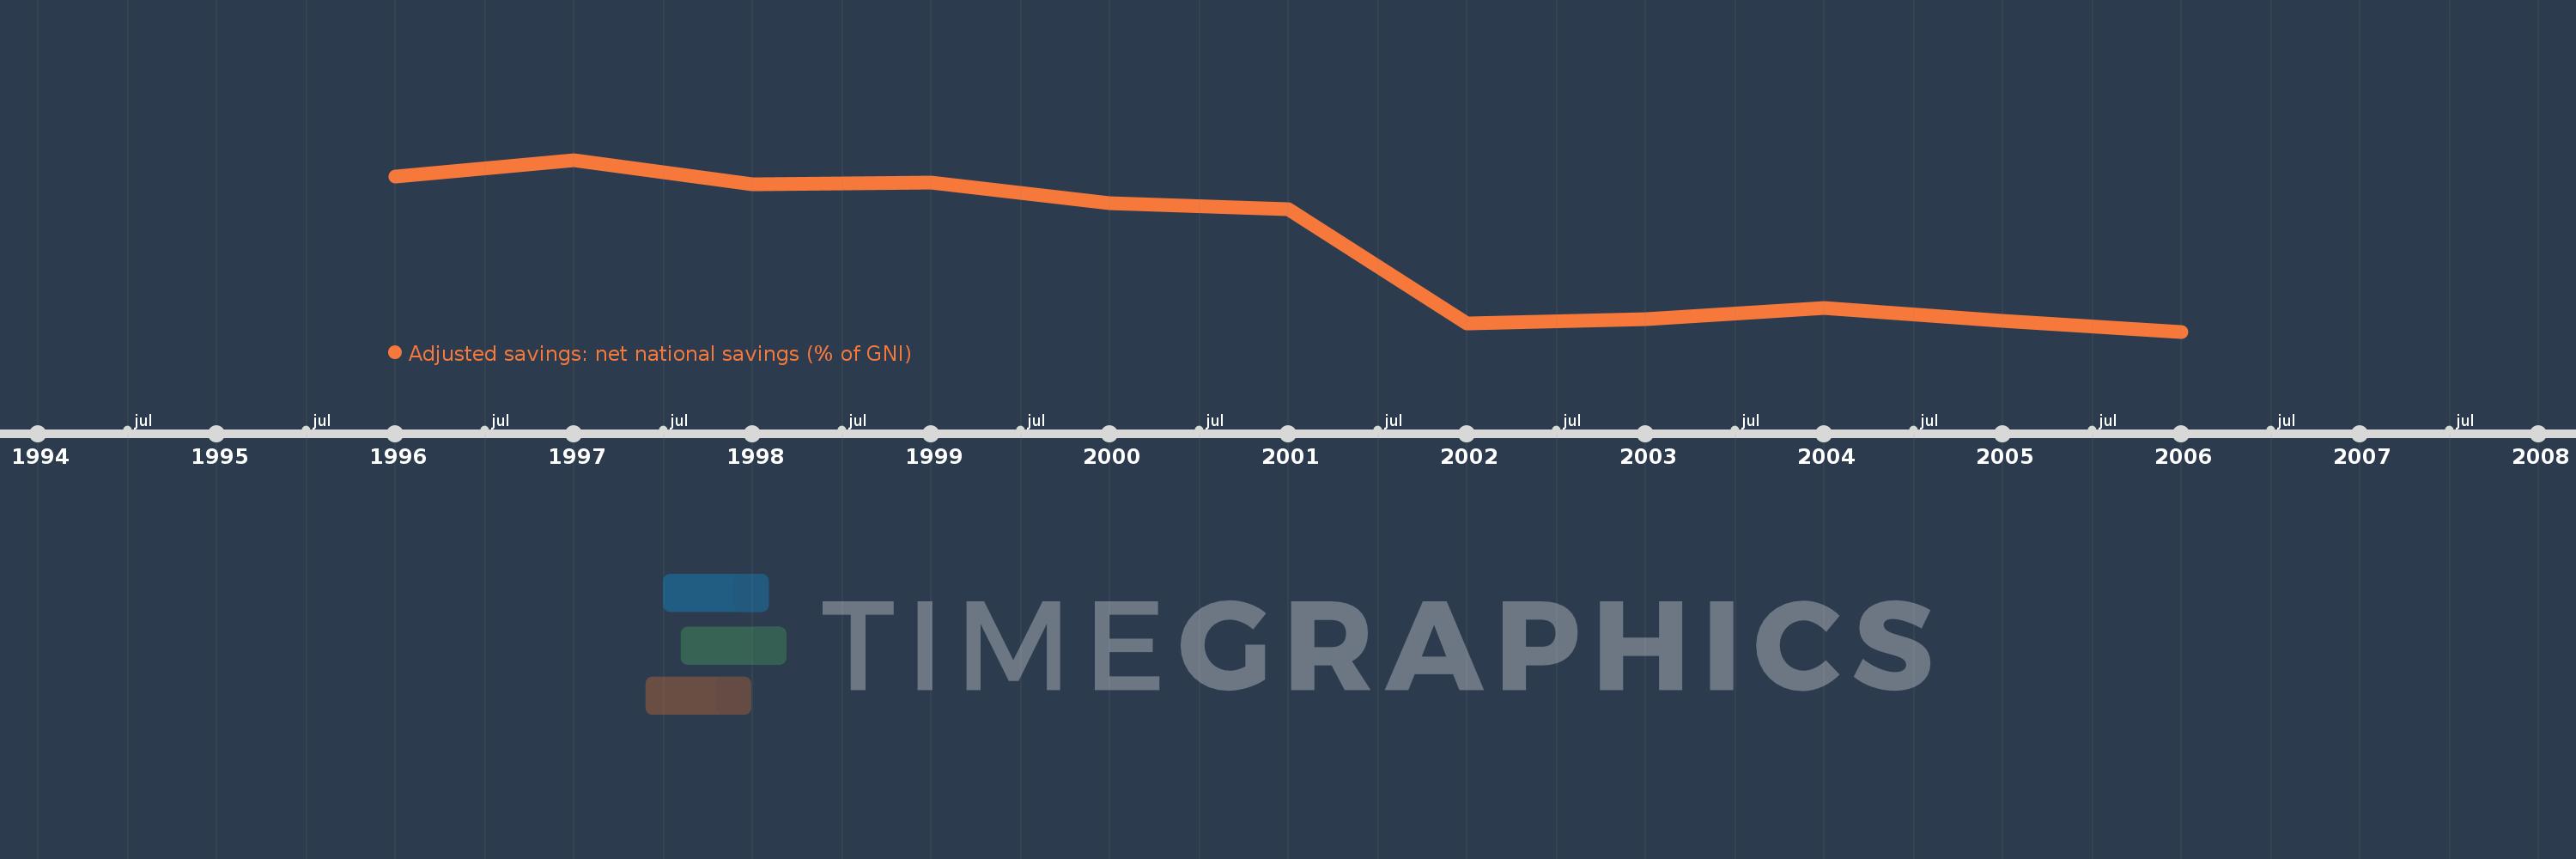
This timeline shows a graph from 1996 to 2006 of Maldives. No data until 1995. Number of actual observations by date: 11.
Source name:
World Development Indicators
Source organization:
World Bank staff estimates based on sources and methods in World Bank's "The Changing Wealth of Nations: Measuring Sustainable Development in the New Millennium" (2011).
Categories, topics:
Economy & Growth, Environment
Last updated:
apr 23, 2017
Indicators value changes by year
Meaning:
22.311
Minimum:
4.87
jan 1, 2006
Maximum:
40.355
jan 1, 1997
At the date of observation
Value
Absolute change
Change from the previous value
jan 1, 1996
36.899
+36.899
0.0%
jan 1, 1997
40.355
+3.456
9.37%
jan 1, 1998
35.335
-5.02
-12.44%
jan 1, 1999
35.616
+0.281
0.8%
jan 1, 2000
31.346
-4.27
-11.99%
jan 1, 2001
30.189
-1.157
-3.69%
jan 1, 2002
6.583
-23.606
-78.19%
jan 1, 2003
7.441
+0.858
13.03%
jan 1, 2004
9.765
+2.324
31.23%
jan 1, 2005
7.02
-2.746
-28.12%
jan 1, 2006
4.87
-2.15
-30.62%
Ranking of countries by current statistics by years