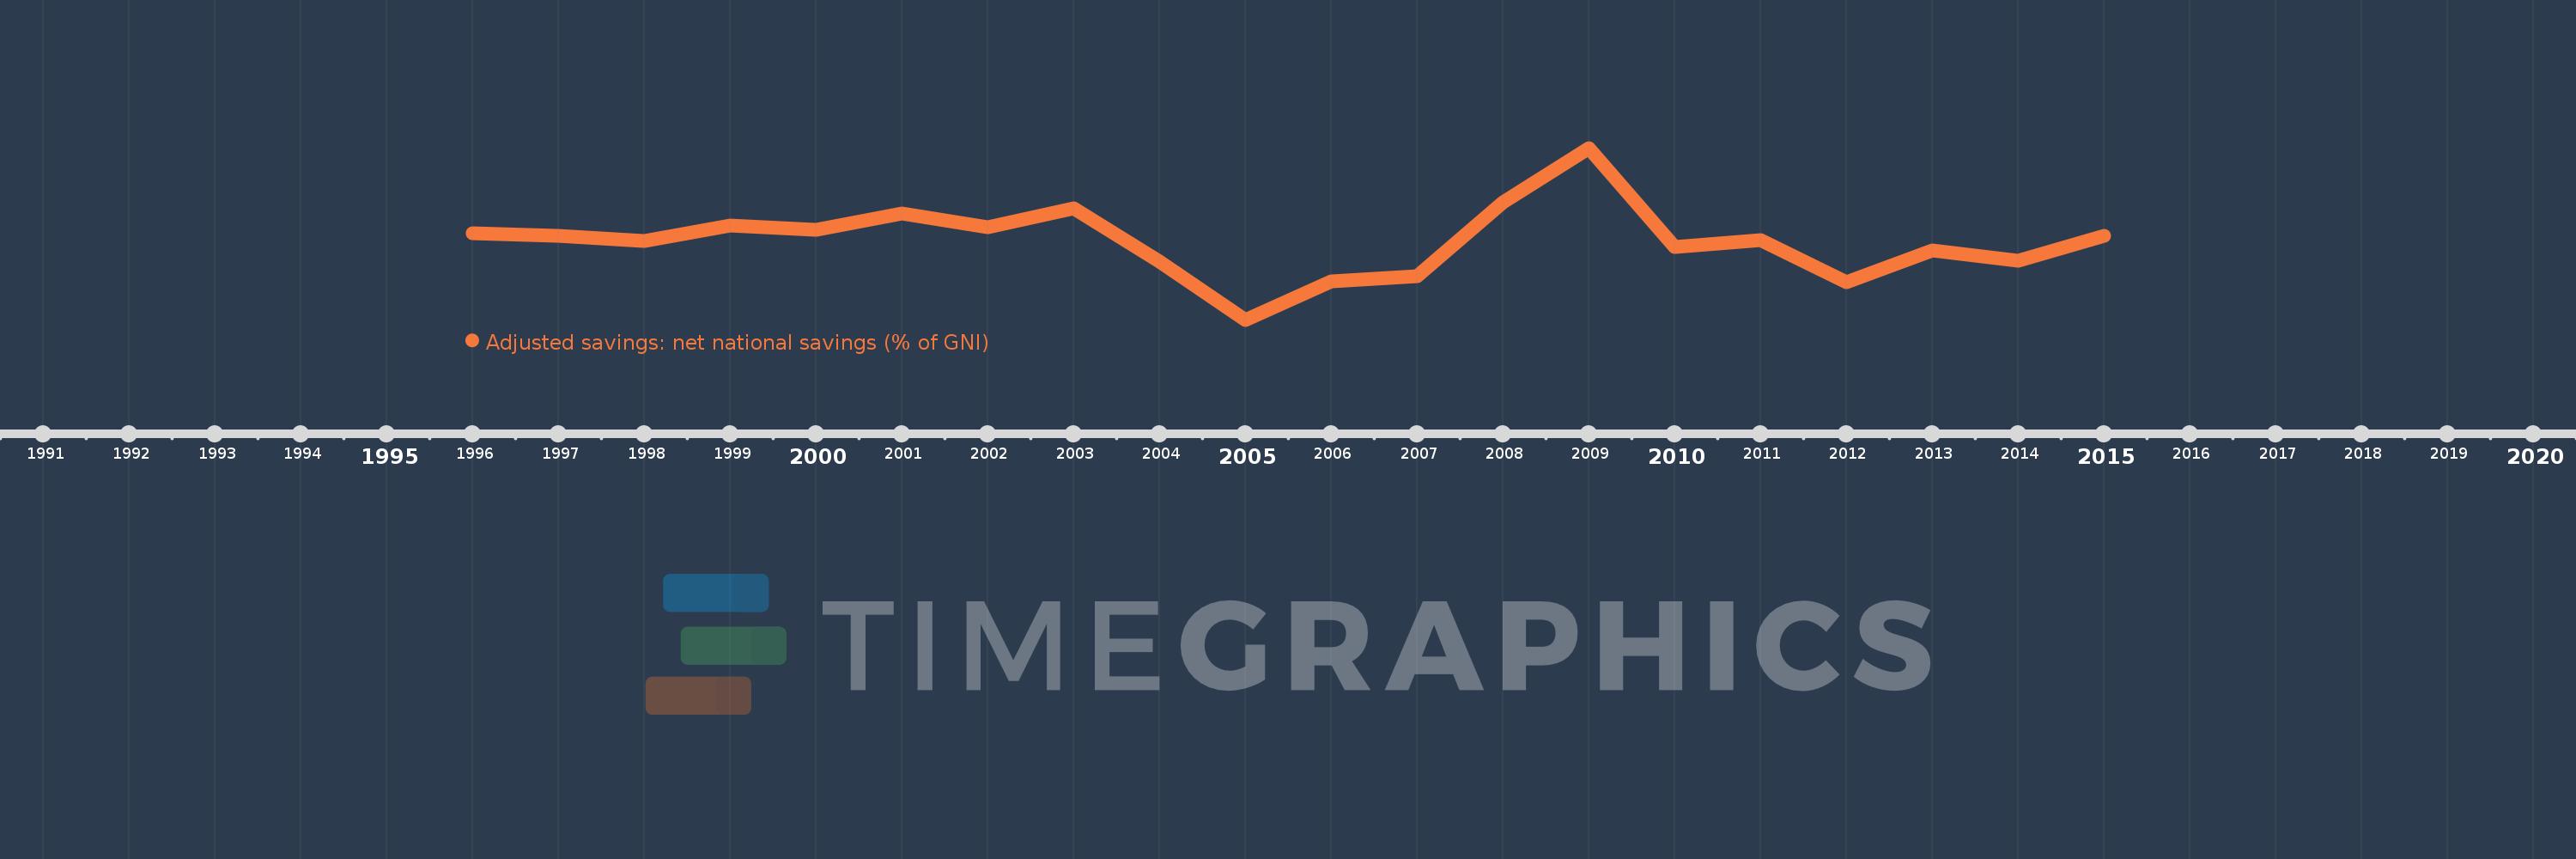
This timeline shows a graph from 1996 to 2015 of West Bank and Gaza. No data until 1995. Number of actual observations by date: 20.
Source name:
World Development Indicators
Source organization:
World Bank staff estimates based on sources and methods in World Bank's "The Changing Wealth of Nations: Measuring Sustainable Development in the New Millennium" (2011).
Categories, topics:
Economy & Growth, Environment
Last updated:
apr 23, 2017
Indicators value changes by year
Meaning:
-2.006
Minimum:
-17.42
jan 1, 2005
Maximum:
16.223
jan 1, 2009
At the date of observation
Value
Absolute change
Change from the previous value
jan 1, 1996
-0.439
-0.439
0.0%
jan 1, 1997
-1.024
-0.585
133.43%
jan 1, 1998
-1.956
-0.932
90.97%
jan 1, 1999
0.997
+2.953
-150.97%
jan 1, 2000
0.248
-0.749
-75.1%
jan 1, 2001
3.347
+3.099
1.25K%
jan 1, 2002
0.701
-2.646
-79.06%
jan 1, 2003
4.422
+3.721
530.85%
jan 1, 2004
-6.064
-10.485
-237.13%
jan 1, 2005
-17.42
-11.356
187.28%
jan 1, 2006
-9.965
+7.454
-42.79%
jan 1, 2007
-8.971
+0.995
-9.98%
jan 1, 2008
5.571
+14.542
-162.1%
jan 1, 2009
16.223
+10.652
191.21%
jan 1, 2010
-3.147
-19.37
-119.4%
jan 1, 2011
-1.872
+1.275
-40.52%
jan 1, 2012
-10.044
-8.172
436.57%
jan 1, 2013
-3.904
+6.14
-61.13%
jan 1, 2014
-5.814
-1.91
48.93%
jan 1, 2015
-1.001
+4.813
-82.78%
Ranking of countries by current statistics by years