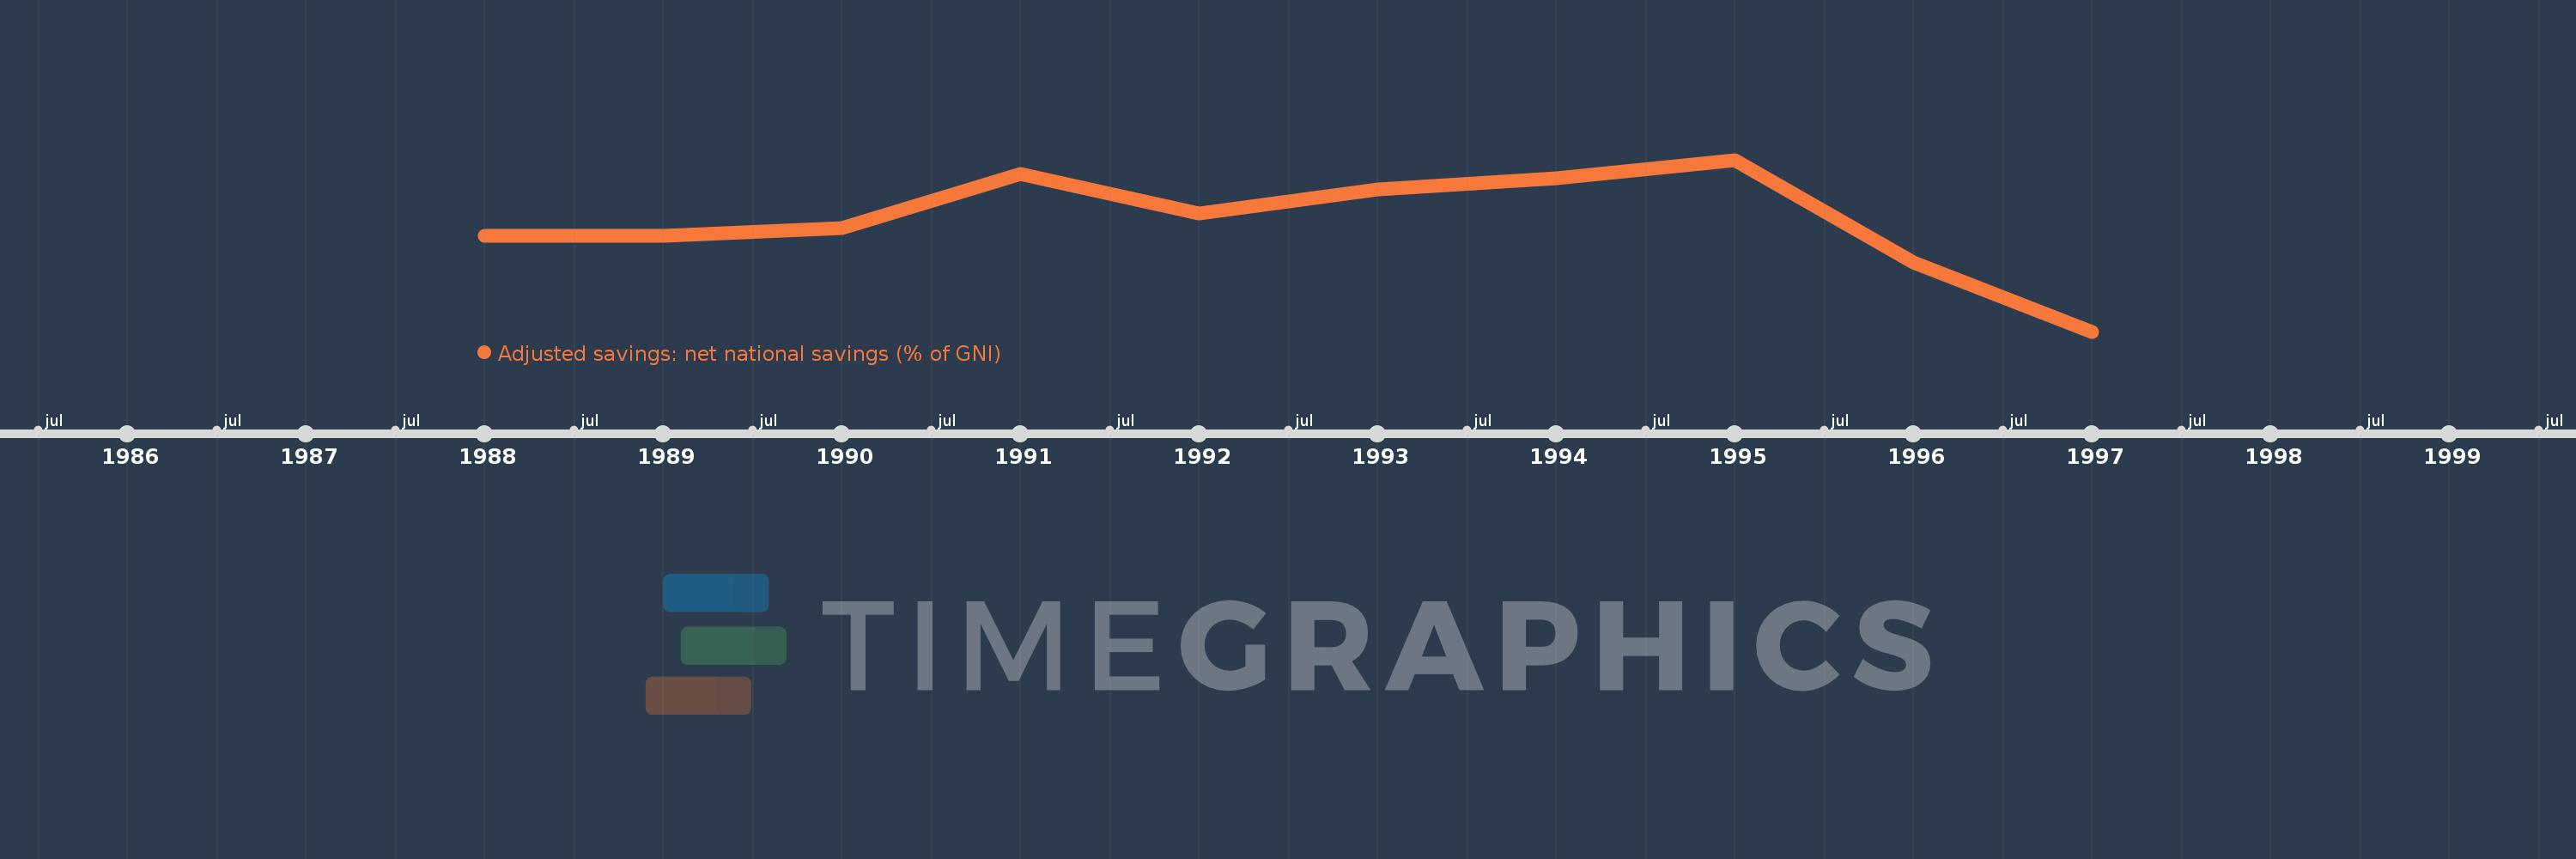
This timeline shows a graph from 1988 to 1997 of Equatorial Guinea. No data until 1987. Number of actual observations by date: 10.
Source name:
World Development Indicators
Source organization:
World Bank staff estimates based on sources and methods in World Bank's "The Changing Wealth of Nations: Measuring Sustainable Development in the New Millennium" (2011).
Categories, topics:
Economy & Growth, Environment
Last updated:
apr 23, 2017
Indicators value changes by year
Meaning:
-33.186
Minimum:
-182.301
jan 1, 1997
Maximum:
49.102
jan 1, 1995
At the date of observation
Value
Absolute change
Change from the previous value
jan 1, 1988
-52.948
-52.948
0.0%
jan 1, 1989
-53.011
-0.063
0.12%
jan 1, 1990
-43.11
+9.901
-18.68%
jan 1, 1991
30.171
+73.281
-169.99%
jan 1, 1992
-22.788
-52.959
-175.53%
jan 1, 1993
8.78
+31.568
-138.53%
jan 1, 1994
23.917
+15.137
172.39%
jan 1, 1995
49.102
+25.185
105.3%
jan 1, 1996
-89.677
-138.779
-282.63%
jan 1, 1997
-182.301
-92.624
103.29%
Ranking of countries by current statistics by years