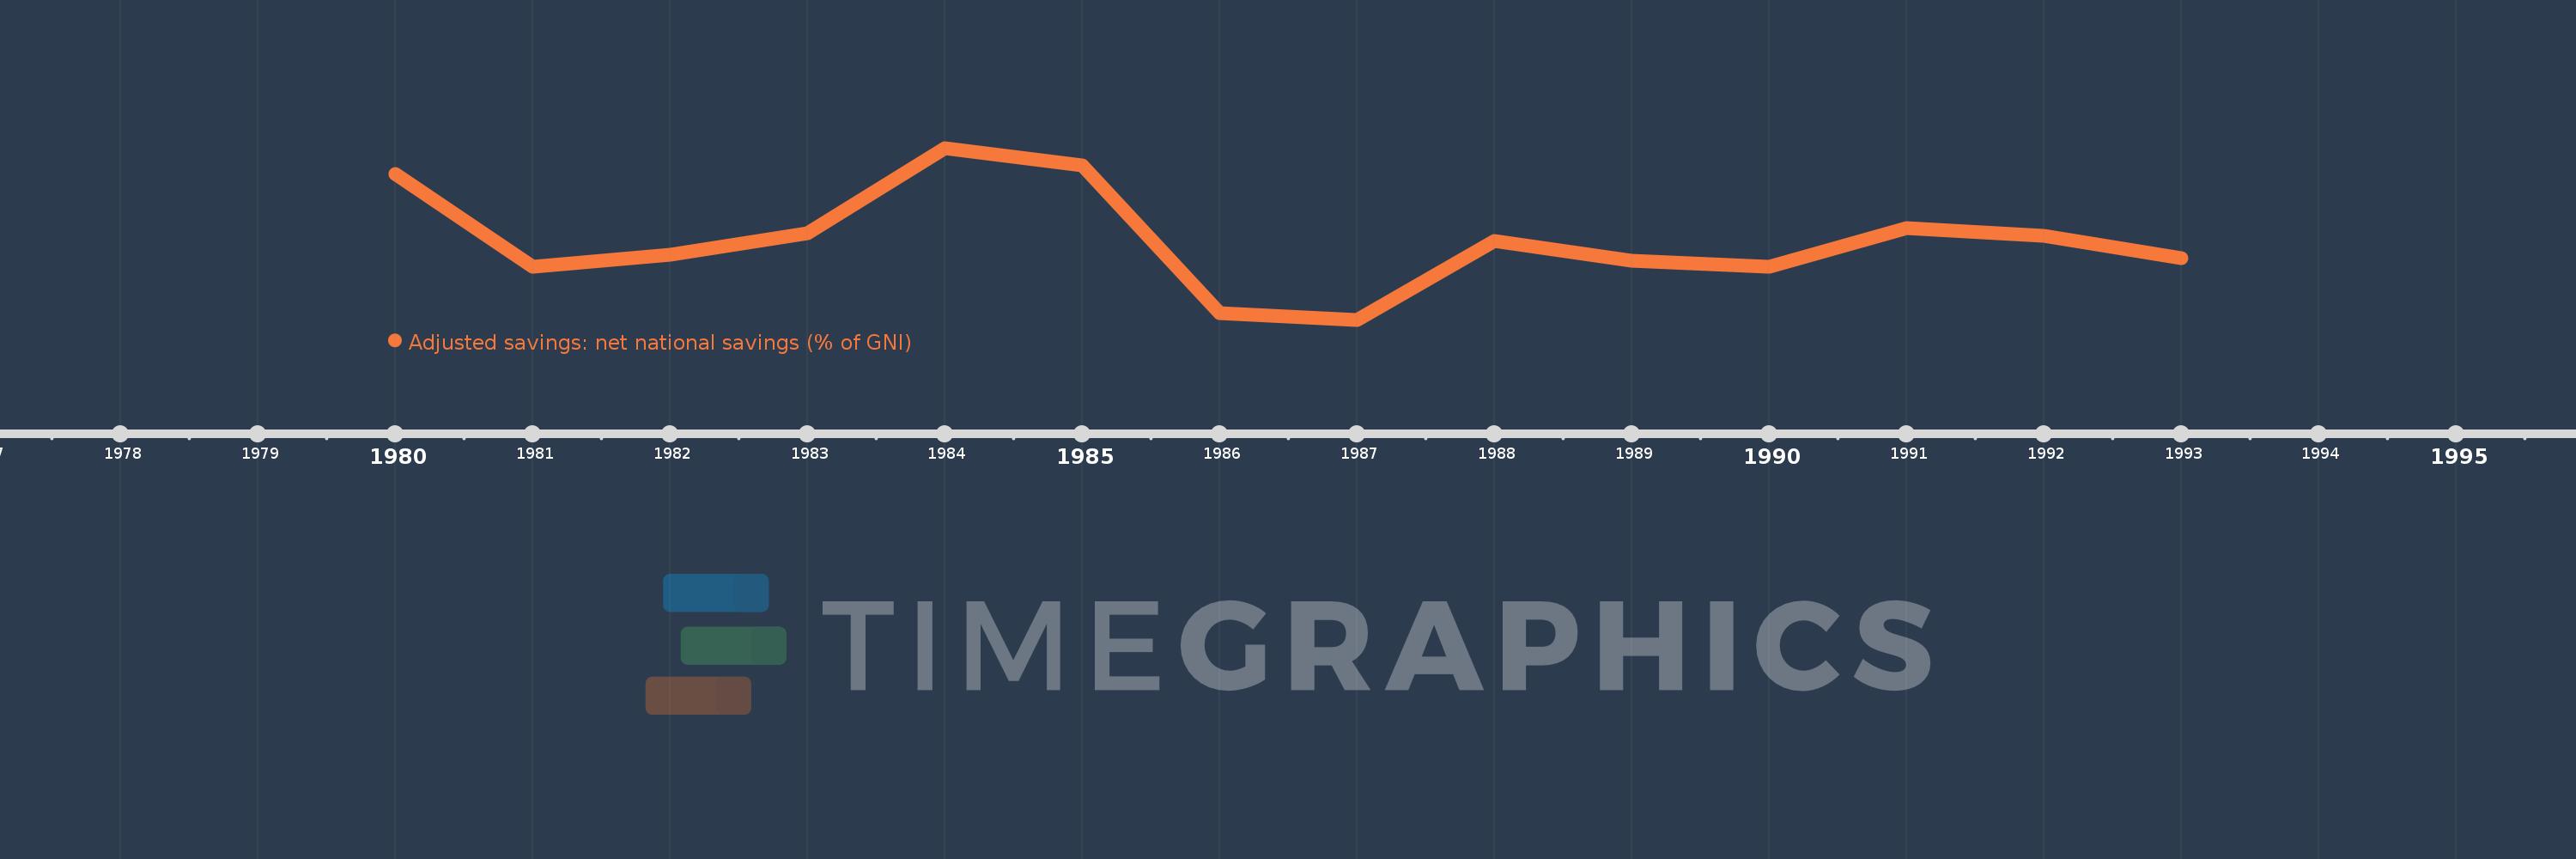
This timeline shows a graph from 1980 to 1993 of Kiribati. No data until 1979. Number of actual observations by date: 14.
Source name:
World Development Indicators
Source organization:
World Bank staff estimates based on sources and methods in World Bank's "The Changing Wealth of Nations: Measuring Sustainable Development in the New Millennium" (2011).
Categories, topics:
Economy & Growth, Environment
Last updated:
apr 23, 2017
Indicators value changes by year
Meaning:
28.003
Minimum:
11.457
jan 1, 1987
Maximum:
47.265
jan 1, 1984
At the date of observation
Value
Absolute change
Change from the previous value
jan 1, 1980
41.921
+41.921
0.0%
jan 1, 1981
22.483
-19.438
-46.37%
jan 1, 1982
25.028
+2.545
11.32%
jan 1, 1983
29.483
+4.455
17.8%
jan 1, 1984
47.265
+17.781
60.31%
jan 1, 1985
43.703
-3.561
-7.53%
jan 1, 1986
12.876
-30.827
-70.54%
jan 1, 1987
11.457
-1.419
-11.02%
jan 1, 1988
27.8
+16.342
142.64%
jan 1, 1989
23.796
-4.004
-14.4%
jan 1, 1990
22.449
-1.347
-5.66%
jan 1, 1991
30.51
+8.061
35.91%
jan 1, 1992
29.038
-1.472
-4.83%
jan 1, 1993
24.231
-4.806
-16.55%
Ranking of countries by current statistics by years