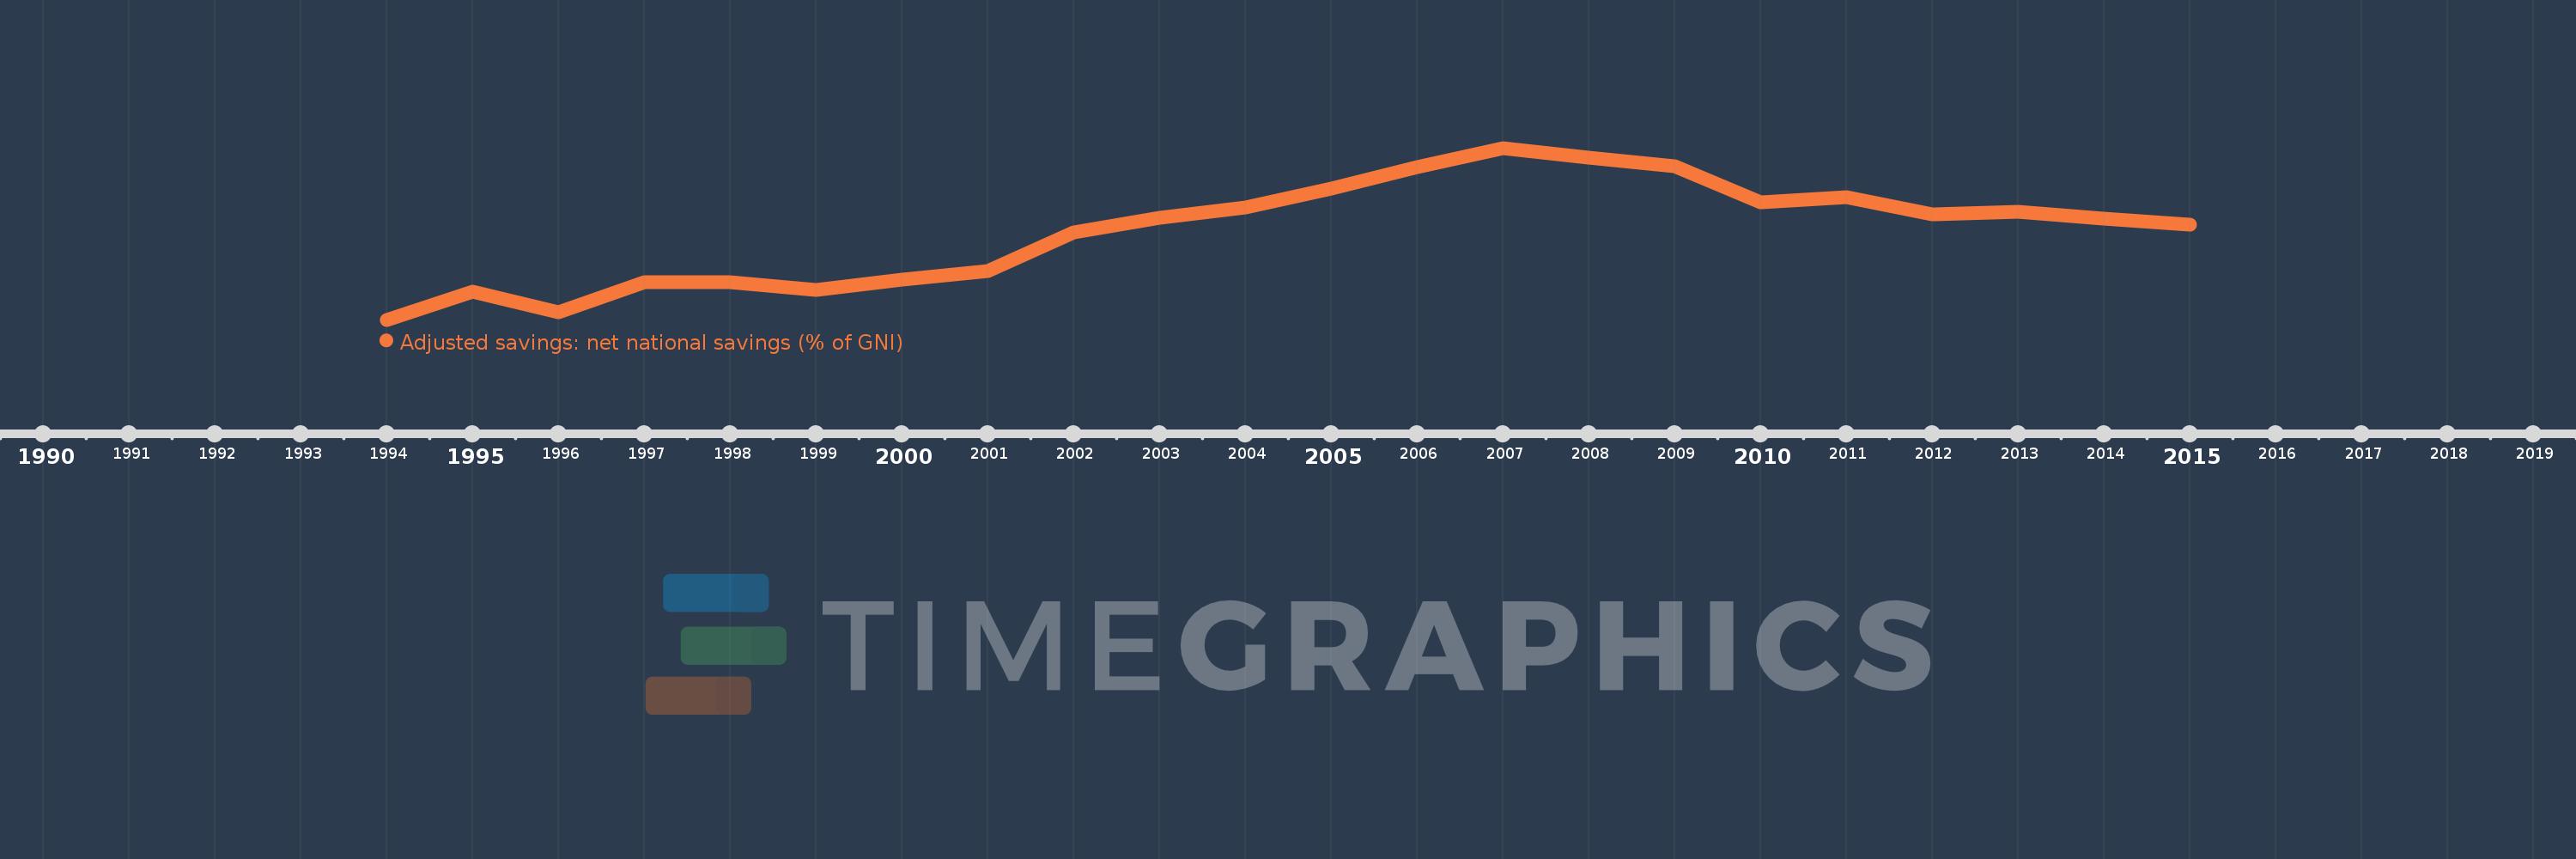
This timeline shows a graph from 1994 to 2015 of Armenia. No data until 1993. Number of actual observations by date: 22.
Source name:
World Development Indicators
Source organization:
World Bank staff estimates based on sources and methods in World Bank's "The Changing Wealth of Nations: Measuring Sustainable Development in the New Millennium" (2011).
Categories, topics:
Economy & Growth, Environment
Last updated:
apr 23, 2017
Indicators value changes by year
Meaning:
-0.565
Minimum:
-23.686
jan 1, 1994
Maximum:
21.137
jan 1, 2007
At the date of observation
Value
Absolute change
Change from the previous value
jan 1, 1994
-23.686
-23.686
0.0%
jan 1, 1995
-16.424
+7.262
-30.66%
jan 1, 1996
-21.664
-5.24
31.9%
jan 1, 1997
-13.89
+7.774
-35.88%
jan 1, 1998
-13.79
+0.1
-0.72%
jan 1, 1999
-15.872
-2.082
15.1%
jan 1, 2000
-13.257
+2.614
-16.47%
jan 1, 2001
-11.074
+2.184
-16.47%
jan 1, 2002
-0.982
+10.092
-91.13%
jan 1, 2003
2.816
+3.798
-386.84%
jan 1, 2004
5.549
+2.732
97.02%
jan 1, 2005
10.475
+4.927
88.8%
jan 1, 2006
16.143
+5.667
54.1%
jan 1, 2007
21.137
+4.995
30.94%
jan 1, 2008
18.665
-2.473
-11.7%
jan 1, 2009
16.374
-2.29
-12.27%
jan 1, 2010
6.879
-9.496
-57.99%
jan 1, 2011
8.22
+1.341
19.49%
jan 1, 2012
3.861
-4.359
-53.03%
jan 1, 2013
4.454
+0.593
15.37%
jan 1, 2014
2.599
-1.855
-41.65%
jan 1, 2015
1.035
-1.564
-60.18%
Ranking of countries by current statistics by years