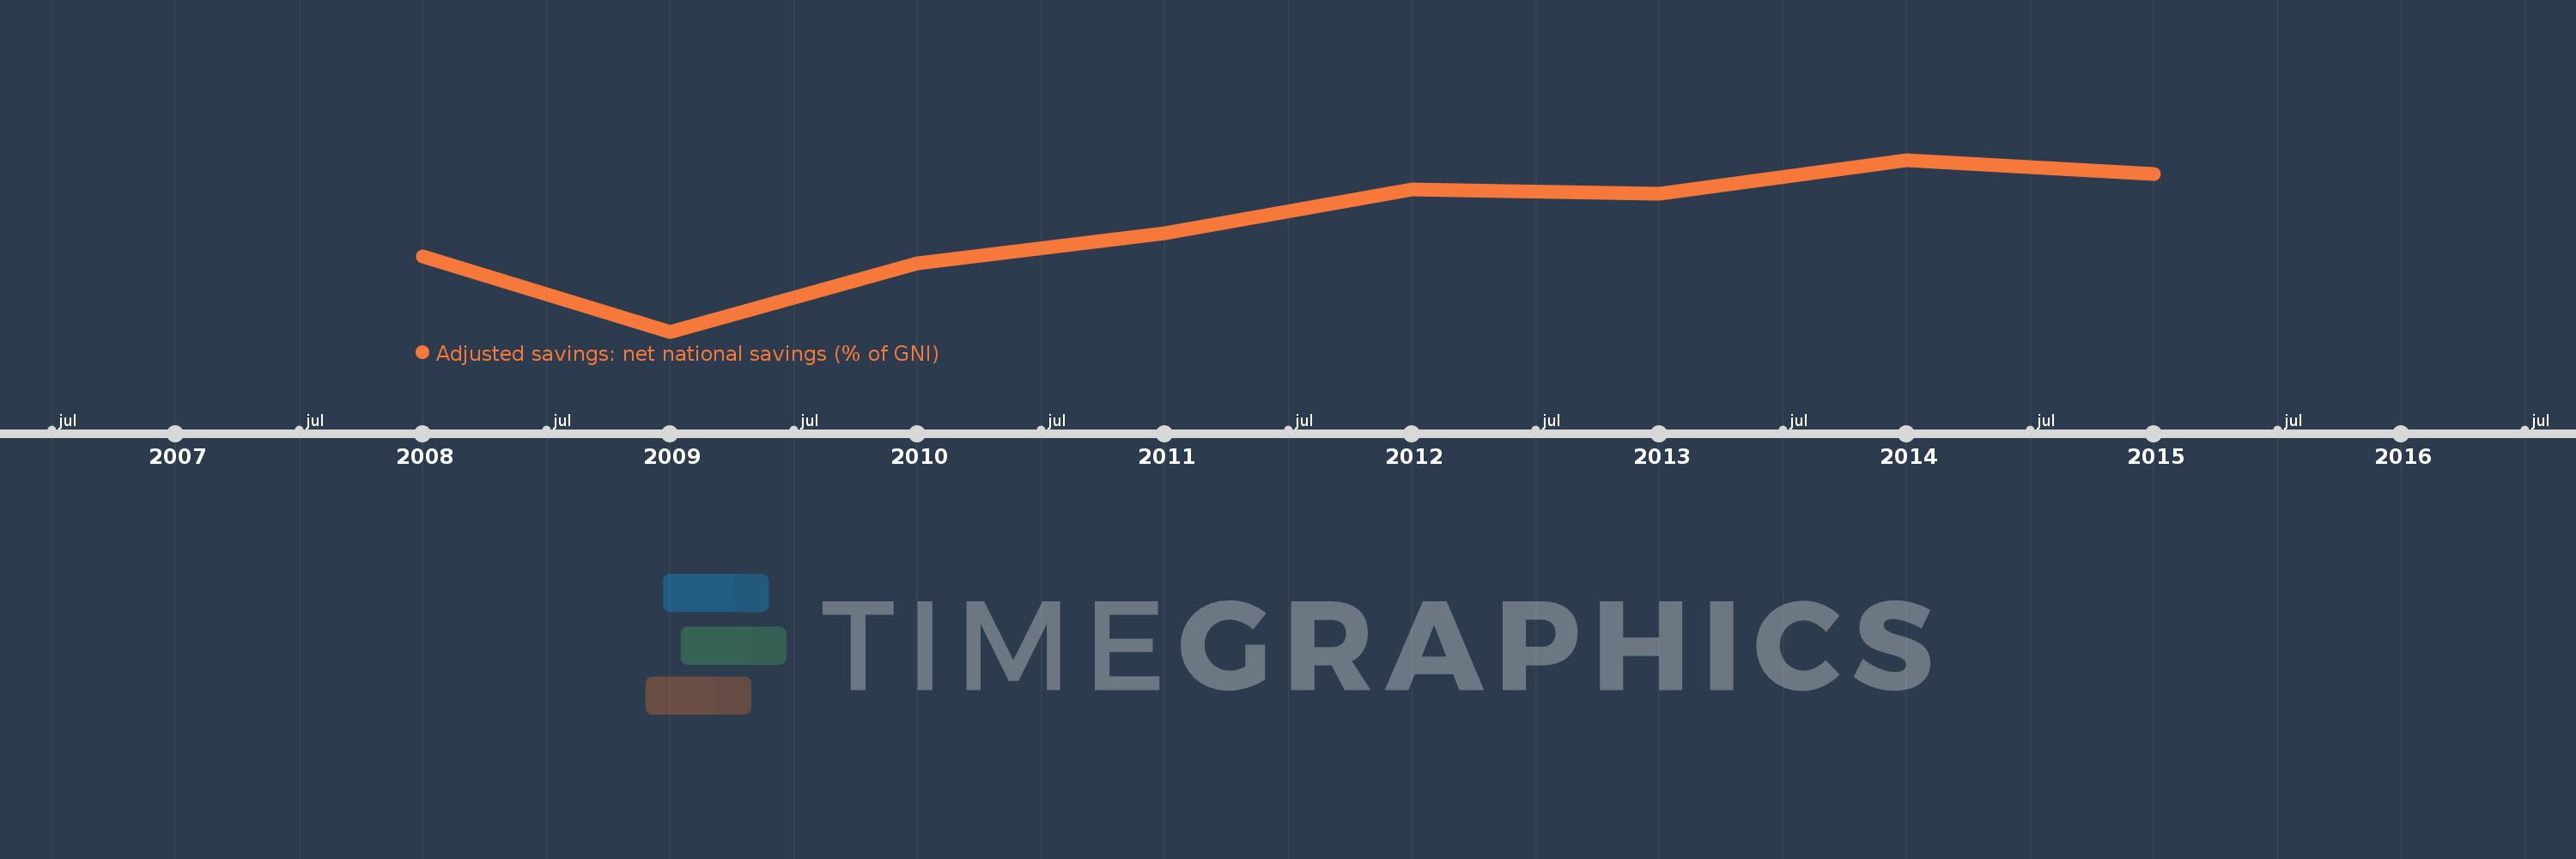
This timeline shows a graph from 2008 to 2015 of Montenegro. No data until 2007. Number of actual observations by date: 8.
Source name:
World Development Indicators
Source organization:
World Bank staff estimates based on sources and methods in World Bank's "The Changing Wealth of Nations: Measuring Sustainable Development in the New Millennium" (2011).
Categories, topics:
Economy & Growth, Environment
Last updated:
apr 23, 2017
Indicators value changes by year
Meaning:
-10.458
Minimum:
-17.43
jan 1, 2009
Maximum:
-6.182
jan 1, 2014
At the date of observation
Value
Absolute change
Change from the previous value
jan 1, 2008
-12.483
-12.483
0.0%
jan 1, 2009
-17.43
-4.947
39.63%
jan 1, 2010
-12.953
+4.477
-25.69%
jan 1, 2011
-10.993
+1.96
-15.13%
jan 1, 2012
-8.113
+2.88
-26.2%
jan 1, 2013
-8.431
-0.318
3.92%
jan 1, 2014
-6.182
+2.249
-26.68%
jan 1, 2015
-7.082
-0.901
14.57%
Ranking of countries by current statistics by years