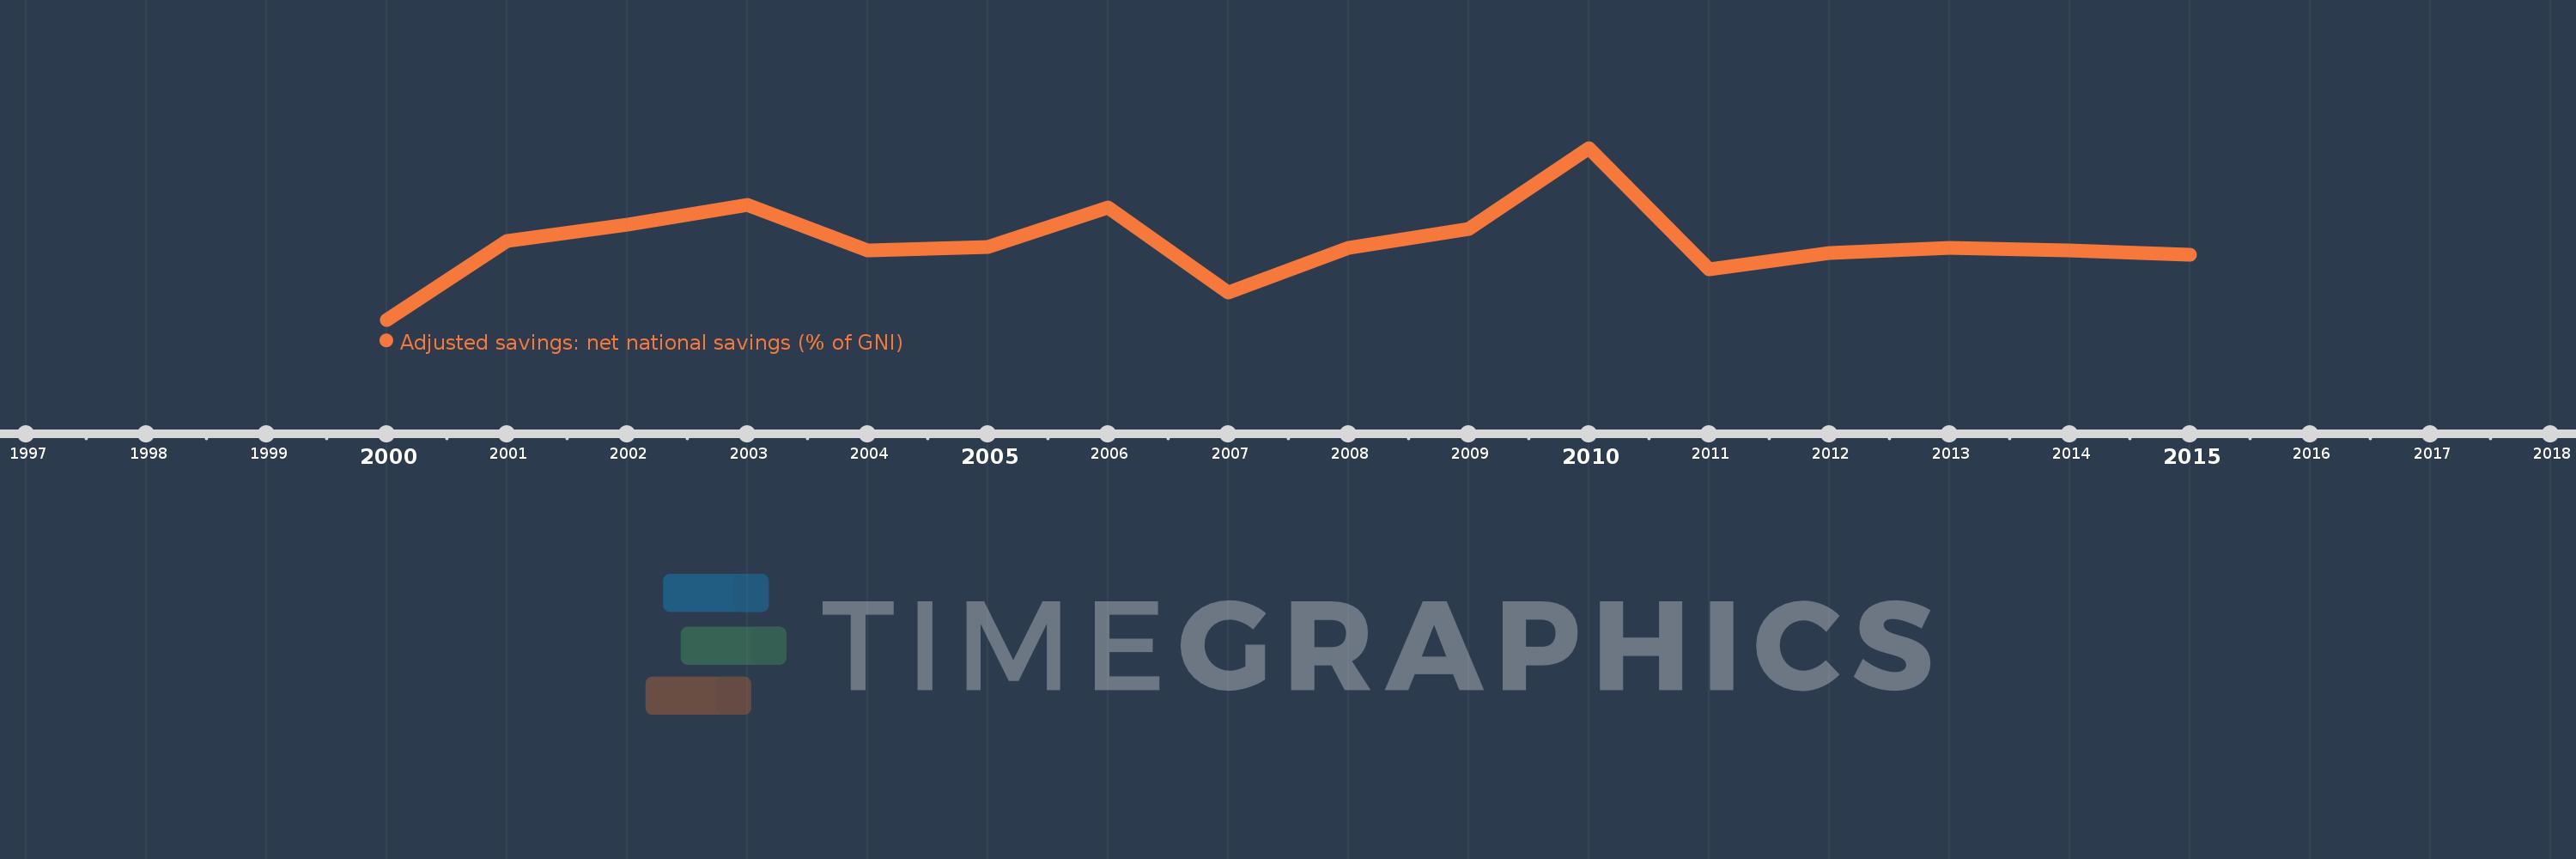
This timeline shows a graph from 2000 to 2015 of Latvia. No data until 1999. Number of actual observations by date: 16.
Source name:
World Development Indicators
Source organization:
World Bank staff estimates based on sources and methods in World Bank's "The Changing Wealth of Nations: Measuring Sustainable Development in the New Millennium" (2011).
Categories, topics:
Economy & Growth, Environment
Last updated:
apr 23, 2017
Indicators value changes by year
Meaning:
-1.671
Minimum:
-7.271
jan 1, 2000
Maximum:
5.26
jan 1, 2010
At the date of observation
Value
Absolute change
Change from the previous value
jan 1, 2000
-7.271
-7.271
0.0%
jan 1, 2001
-1.521
+5.75
-79.08%
jan 1, 2002
-0.335
+1.186
-78.0%
jan 1, 2003
1.125
+1.46
-436.16%
jan 1, 2004
-2.227
-3.352
-298.0%
jan 1, 2005
-1.938
+0.29
-13.01%
jan 1, 2006
0.914
+2.852
-147.17%
jan 1, 2007
-5.309
-6.223
-680.85%
jan 1, 2008
-2.02
+3.289
-61.96%
jan 1, 2009
-0.618
+1.402
-69.42%
jan 1, 2010
5.26
+5.877
-951.63%
jan 1, 2011
-3.615
-8.875
-168.74%
jan 1, 2012
-2.384
+1.232
-34.06%
jan 1, 2013
-2.045
+0.338
-14.2%
jan 1, 2014
-2.218
-0.173
8.45%
jan 1, 2015
-2.541
-0.323
14.55%
Ranking of countries by current statistics by years