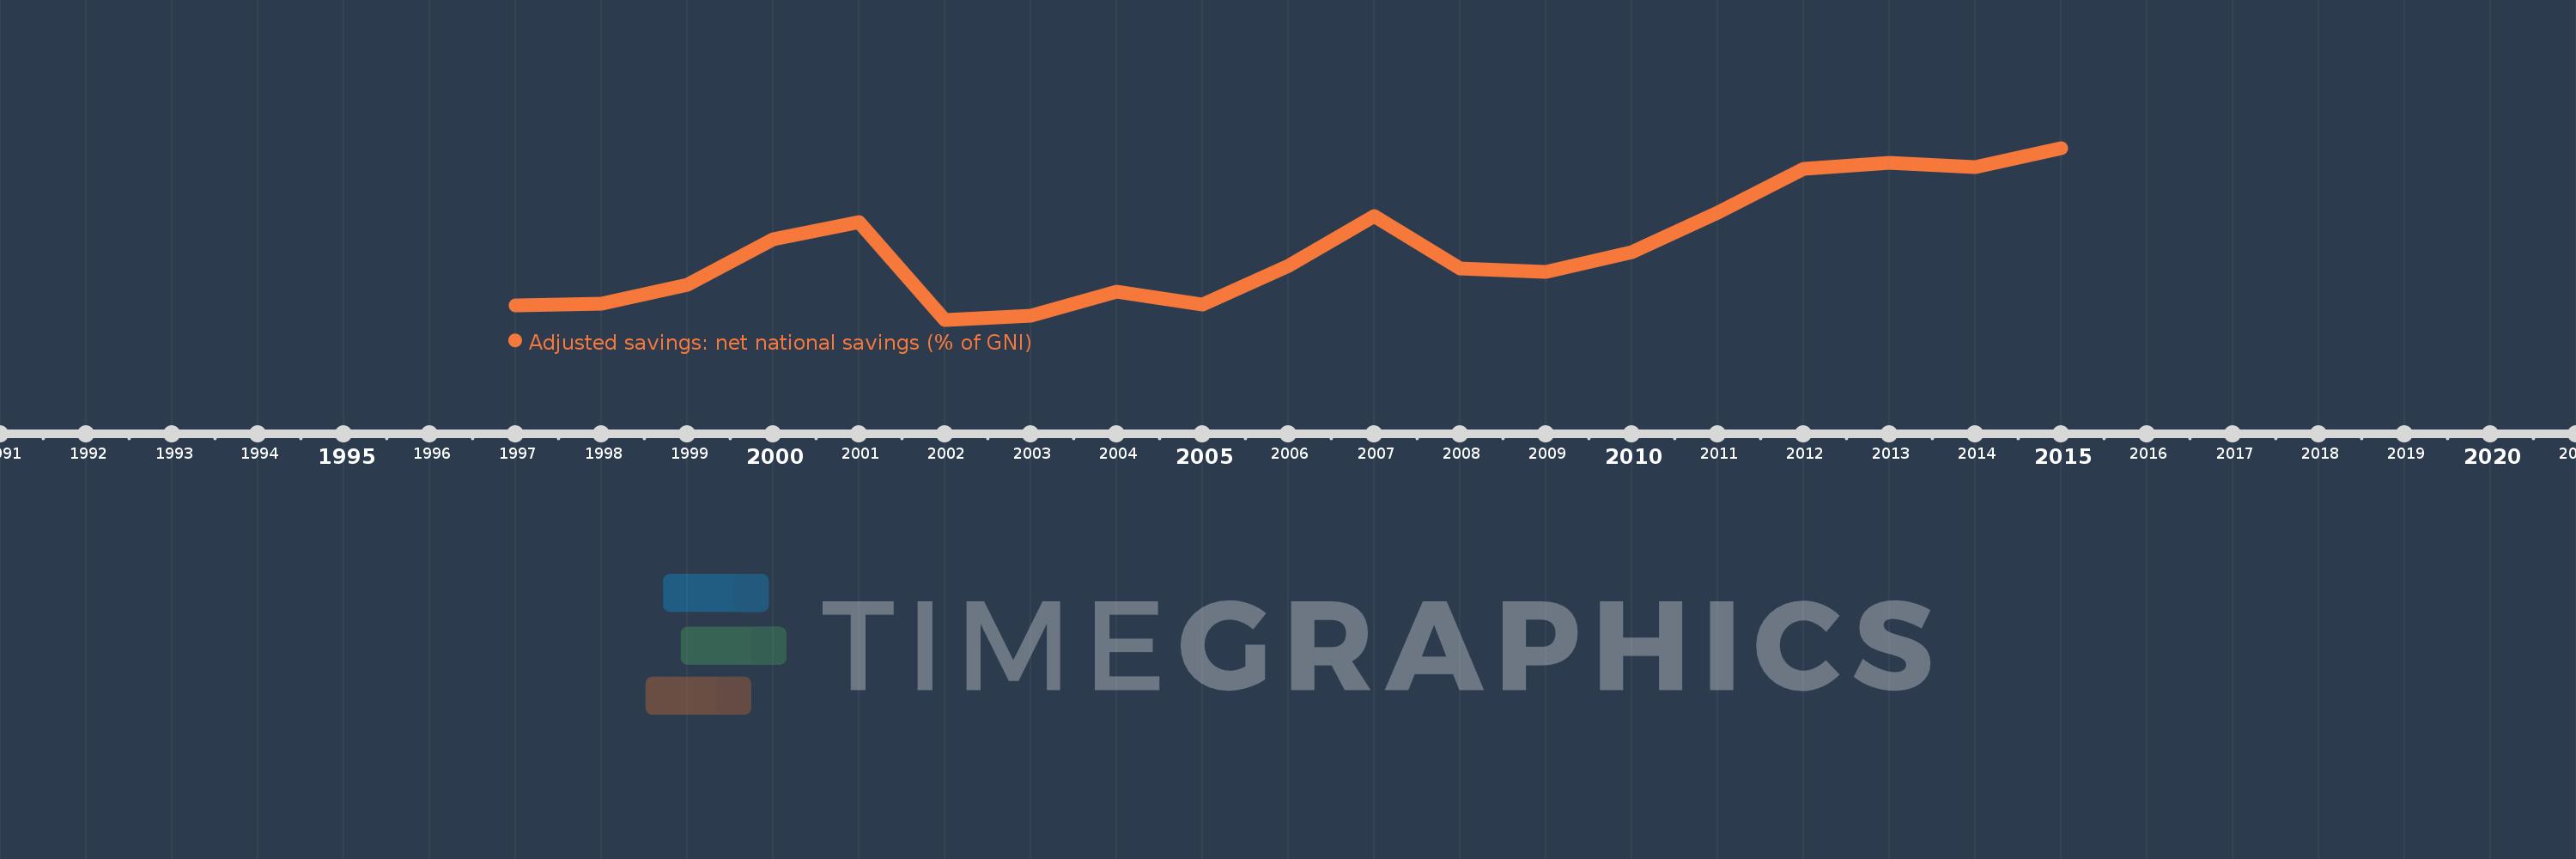
This timeline shows a graph from 1997 to 2015 of Macedonia, FYR. No data until 1996. Number of actual observations by date: 19.
Source name:
World Development Indicators
Source organization:
World Bank staff estimates based on sources and methods in World Bank's "The Changing Wealth of Nations: Measuring Sustainable Development in the New Millennium" (2011).
Categories, topics:
Economy & Growth, Environment
Last updated:
apr 23, 2017
Indicators value changes by year
Meaning:
2.839
Minimum:
-4.826
jan 1, 2002
Maximum:
13.65
jan 1, 2015
At the date of observation
Value
Absolute change
Change from the previous value
jan 1, 1997
-3.27
-3.27
0.0%
jan 1, 1998
-3.087
+0.183
-5.59%
jan 1, 1999
-1.085
+2.002
-64.86%
jan 1, 2000
3.79
+4.875
-449.35%
jan 1, 2001
5.682
+1.892
49.92%
jan 1, 2002
-4.826
-10.509
-184.93%
jan 1, 2003
-4.355
+0.471
-9.75%
jan 1, 2004
-1.779
+2.577
-59.16%
jan 1, 2005
-3.233
-1.454
81.77%
jan 1, 2006
0.966
+4.199
-129.87%
jan 1, 2007
6.312
+5.346
553.59%
jan 1, 2008
0.683
-5.629
-89.18%
jan 1, 2009
0.314
-0.37
-54.09%
jan 1, 2010
2.464
+2.15
685.64%
jan 1, 2011
6.667
+4.203
170.58%
jan 1, 2012
11.425
+4.758
71.37%
jan 1, 2013
12.009
+0.584
5.11%
jan 1, 2014
11.622
-0.387
-3.23%
jan 1, 2015
13.65
+2.028
17.45%
Ranking of countries by current statistics by years