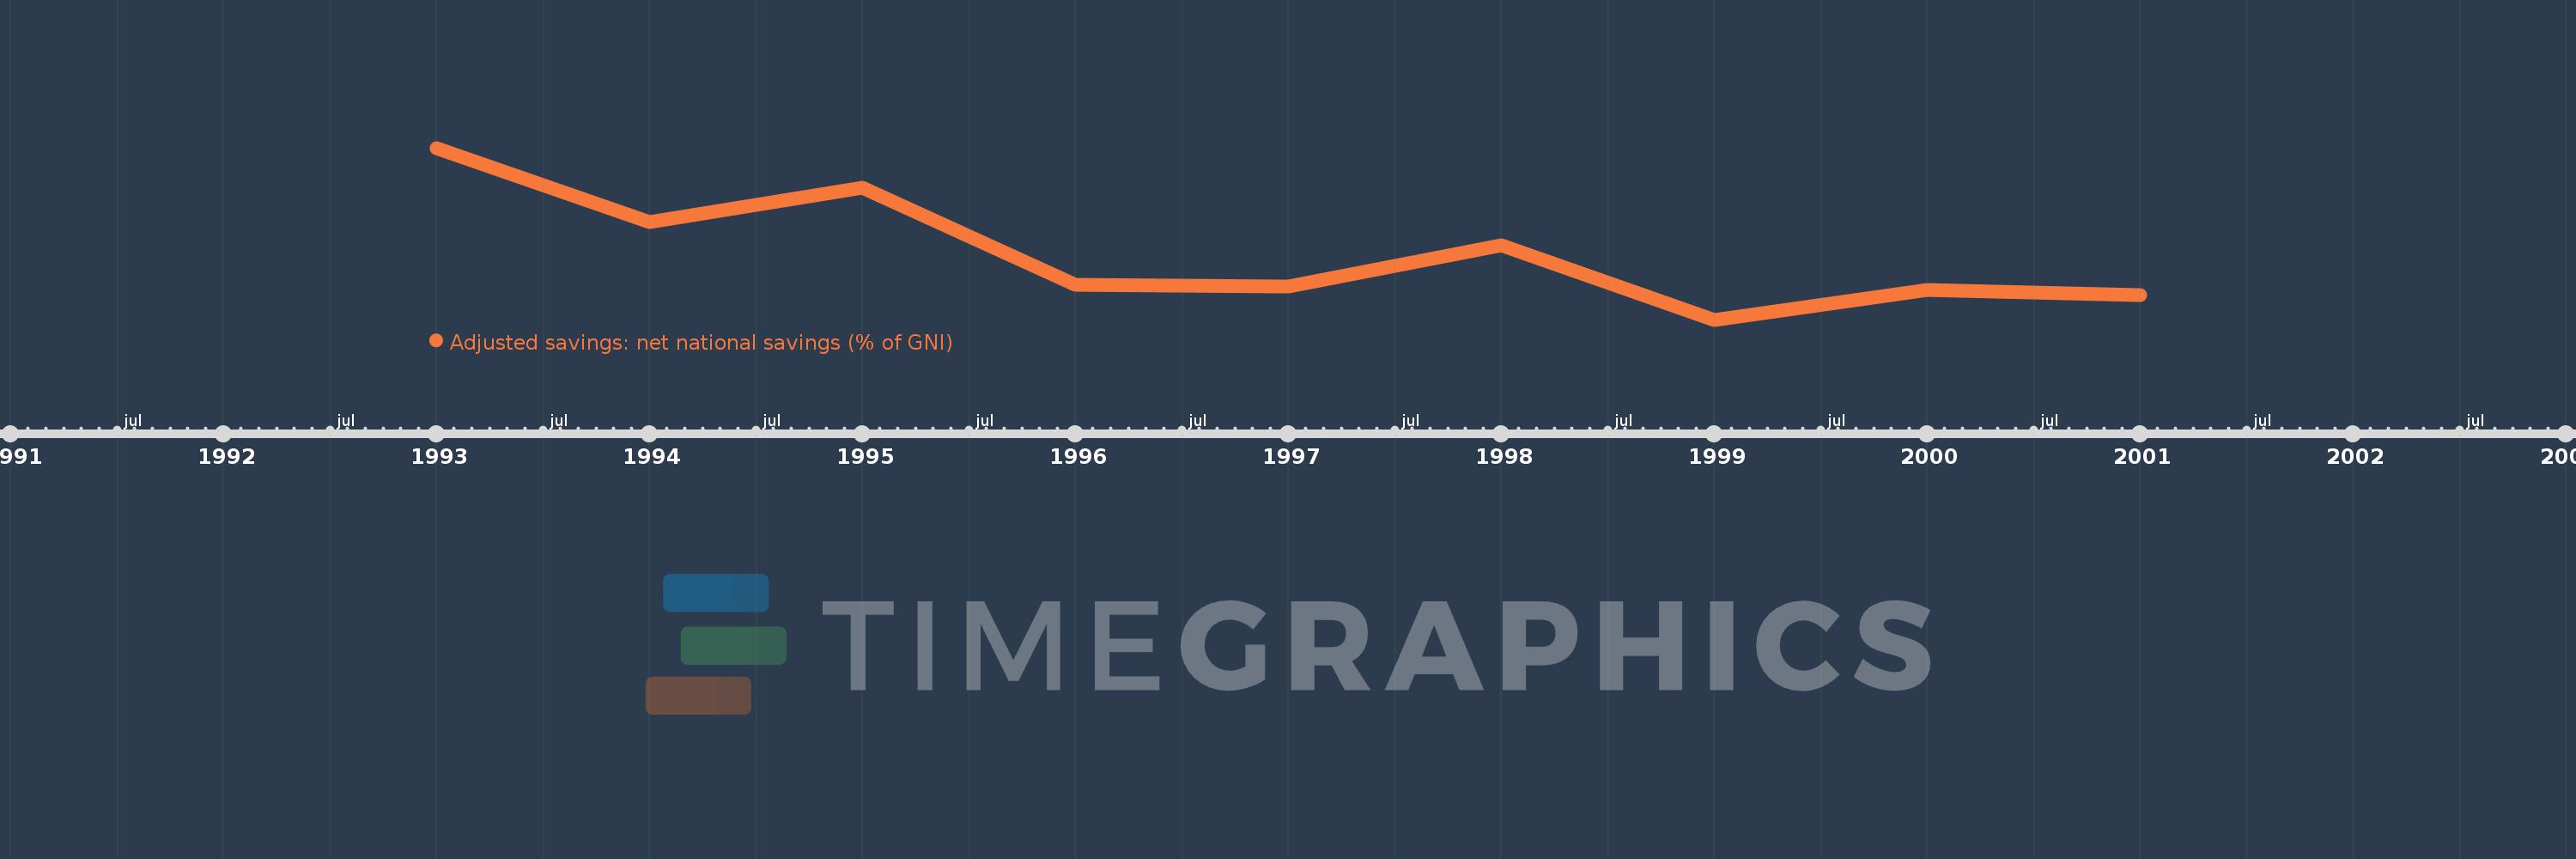
This timeline shows a graph from 1993 to 2001 of Eritrea. No data until 1992. Number of actual observations by date: 9.
Source name:
World Development Indicators
Source organization:
World Bank staff estimates based on sources and methods in World Bank's "The Changing Wealth of Nations: Measuring Sustainable Development in the New Millennium" (2011).
Categories, topics:
Economy & Growth, Environment
Last updated:
apr 23, 2017
Indicators value changes by year
Meaning:
21.361
Minimum:
-3.249
jan 1, 1999
Maximum:
60.222
jan 1, 1993
At the date of observation
Value
Absolute change
Change from the previous value
jan 1, 1993
60.222
+60.222
0.0%
jan 1, 1994
32.804
-27.418
-45.53%
jan 1, 1995
45.645
+12.841
39.14%
jan 1, 1996
9.787
-35.858
-78.56%
jan 1, 1997
9.177
-0.61
-6.23%
jan 1, 1998
24.339
+15.162
165.21%
jan 1, 1999
-3.249
-27.588
-113.35%
jan 1, 2000
7.654
+10.903
-335.55%
jan 1, 2001
5.872
-1.782
-23.28%
Ranking of countries by current statistics by years