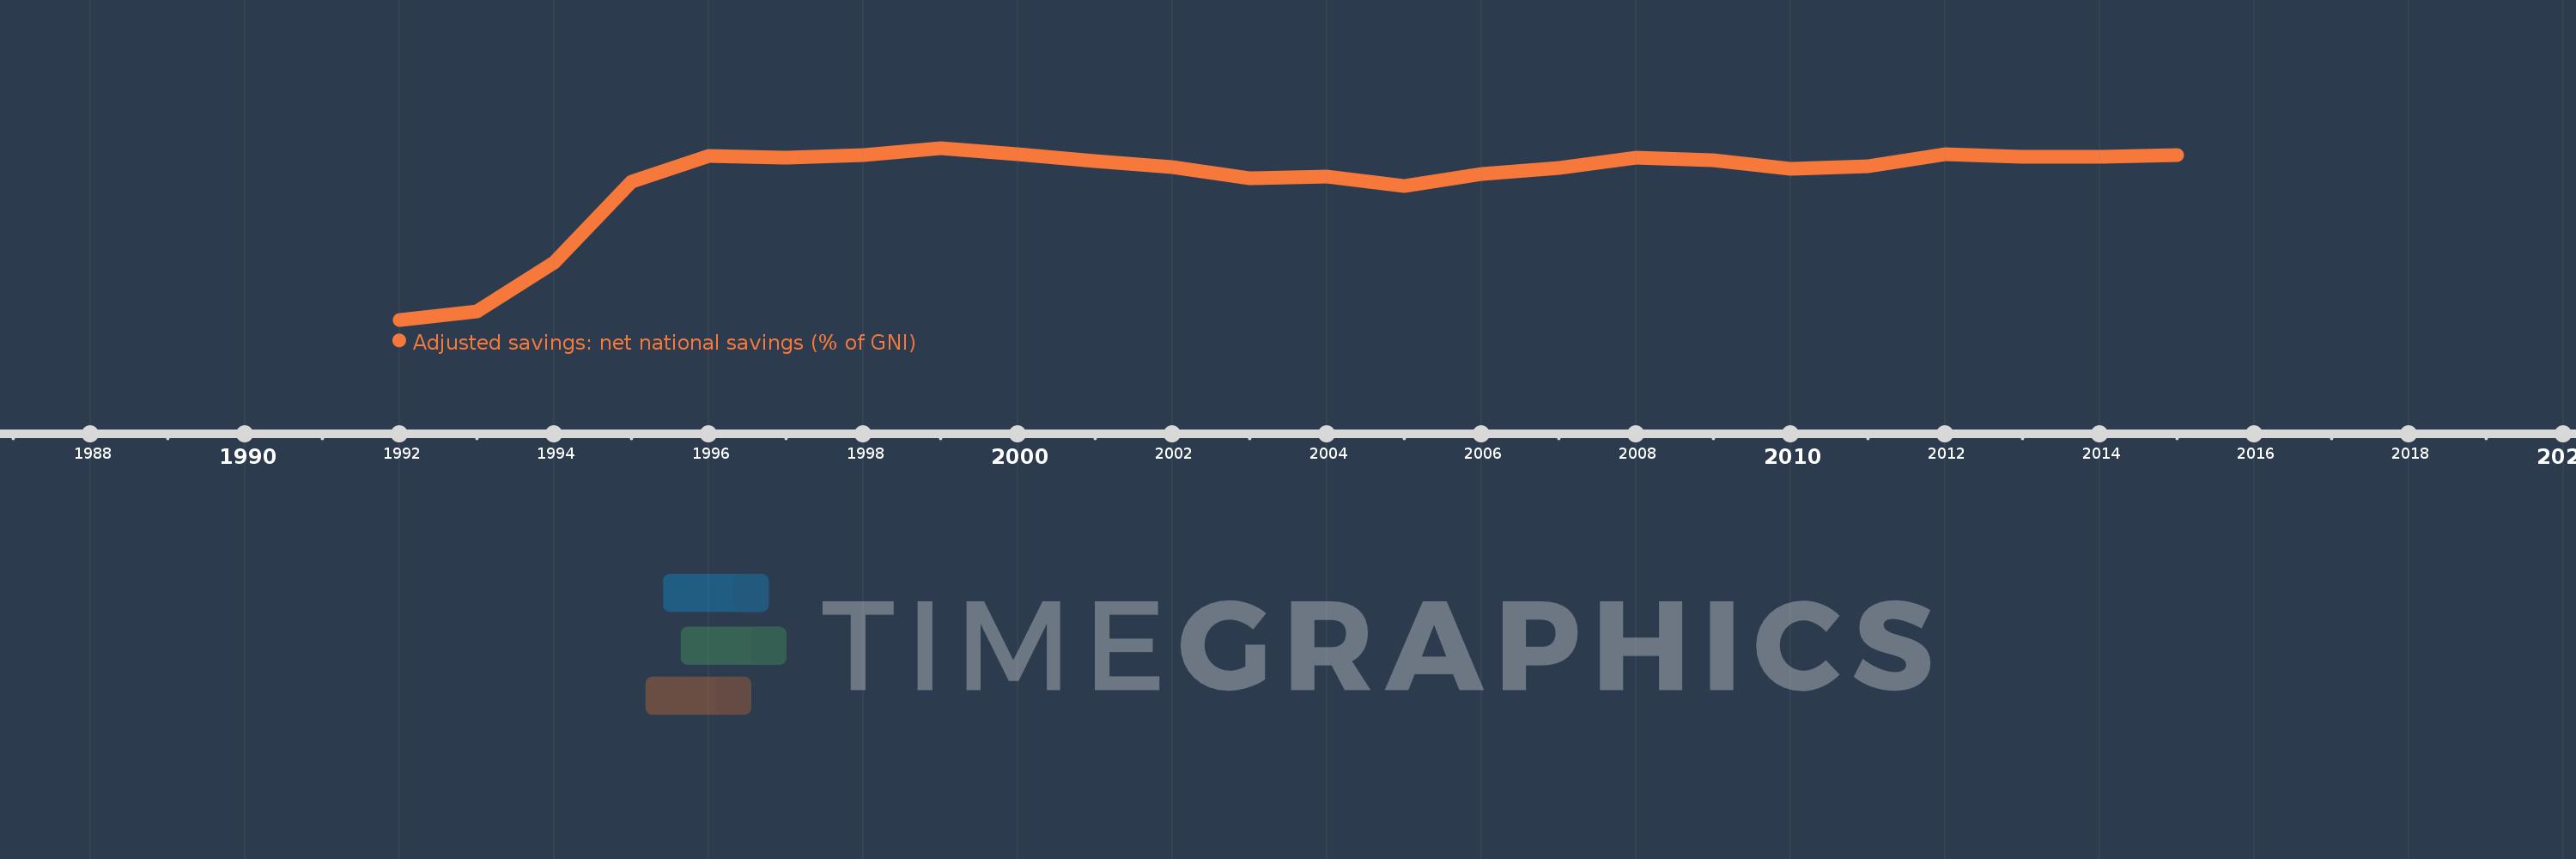
This timeline shows a graph from 1992 to 2015 of Poland. No data until 1991. Number of actual observations by date: 24.
Source name:
World Development Indicators
Source organization:
World Bank staff estimates based on sources and methods in World Bank's "The Changing Wealth of Nations: Measuring Sustainable Development in the New Millennium" (2011).
Categories, topics:
Economy & Growth, Environment
Last updated:
apr 23, 2017
Indicators value changes by year
Meaning:
2.327
Minimum:
-22.505
jan 1, 1992
Maximum:
8.165
jan 1, 1999
At the date of observation
Value
Absolute change
Change from the previous value
jan 1, 1992
-22.505
-22.505
0.0%
jan 1, 1993
-21.032
+1.473
-6.55%
jan 1, 1994
-12.328
+8.704
-41.38%
jan 1, 1995
2.082
+14.409
-116.89%
jan 1, 1996
6.745
+4.664
224.03%
jan 1, 1997
6.36
-0.385
-5.71%
jan 1, 1998
6.884
+0.524
8.24%
jan 1, 1999
8.165
+1.281
18.61%
jan 1, 2000
6.976
-1.189
-14.57%
jan 1, 2001
5.792
-1.184
-16.97%
jan 1, 2002
4.672
-1.119
-19.33%
jan 1, 2003
2.683
-1.99
-42.58%
jan 1, 2004
3.126
+0.443
16.52%
jan 1, 2005
1.379
-1.748
-55.9%
jan 1, 2006
3.554
+2.176
157.81%
jan 1, 2007
4.624
+1.07
30.1%
jan 1, 2008
6.416
+1.792
38.76%
jan 1, 2009
5.977
-0.439
-6.85%
jan 1, 2010
4.455
-1.522
-25.46%
jan 1, 2011
4.909
+0.454
10.2%
jan 1, 2012
7.047
+2.138
43.54%
jan 1, 2013
6.527
-0.519
-7.37%
jan 1, 2014
6.531
+0.004
0.05%
jan 1, 2015
6.816
+0.285
4.37%
Ranking of countries by current statistics by years