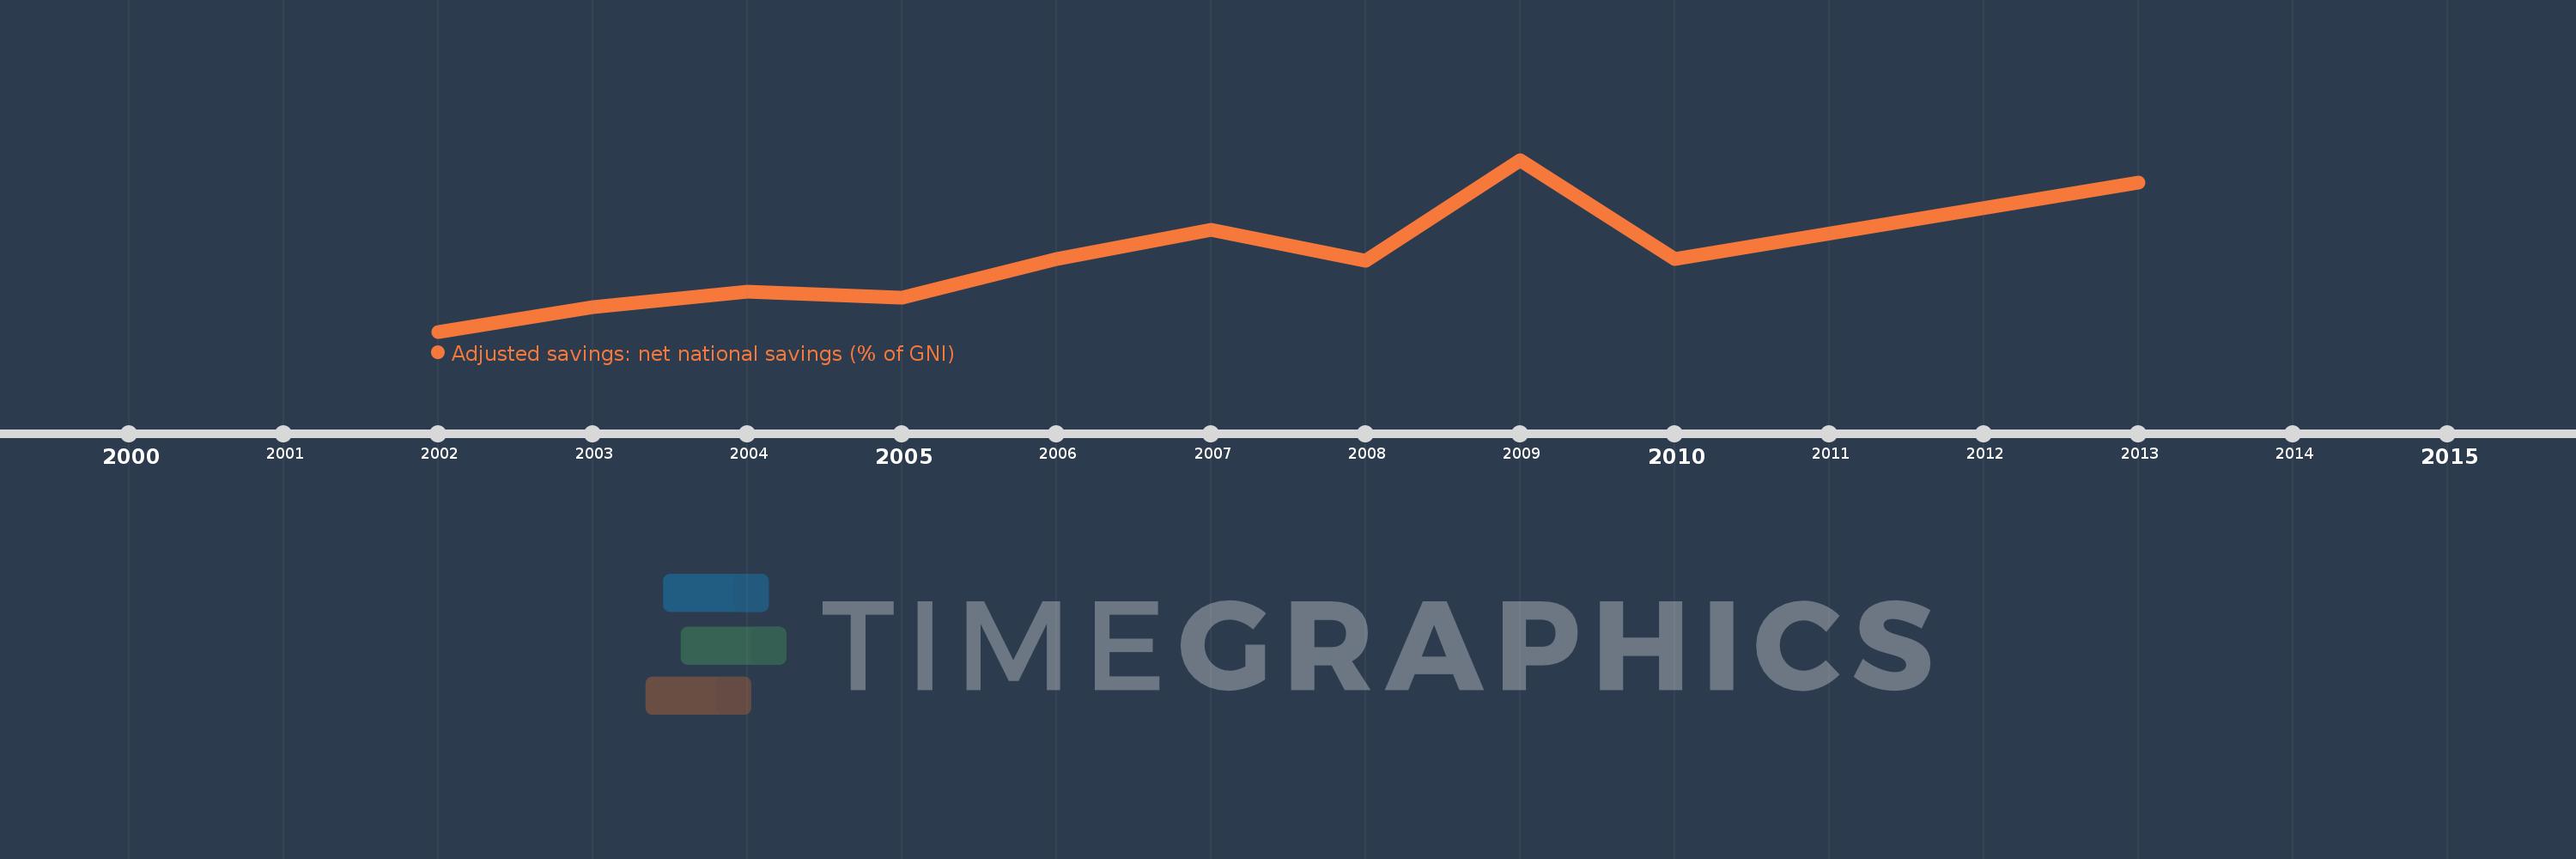
This timeline shows a graph from 2002 to 2013 of Brunei Darussalam. No data until 2001. Number of actual observations by date: 10.
Source name:
World Development Indicators
Source organization:
World Bank staff estimates based on sources and methods in World Bank's "The Changing Wealth of Nations: Measuring Sustainable Development in the New Millennium" (2011).
Categories, topics:
Economy & Growth, Environment
Last updated:
apr 23, 2017
Indicators value changes by year
Meaning:
42.932
Minimum:
34.476
jan 1, 2002
Maximum:
54.194
jan 1, 2009
At the date of observation
Value
Absolute change
Change from the previous value
jan 1, 2002
34.476
+34.476
0.0%
jan 1, 2003
37.335
+2.859
8.29%
jan 1, 2004
39.035
+1.7
4.55%
jan 1, 2005
38.34
-0.695
-1.78%
jan 1, 2006
42.761
+4.421
11.53%
jan 1, 2007
46.187
+3.426
8.01%
jan 1, 2008
42.591
-3.596
-7.79%
jan 1, 2009
54.194
+11.602
27.24%
jan 1, 2010
42.831
-11.362
-20.97%
jan 1, 2013
51.566
+8.734
20.39%
Ranking of countries by current statistics by years