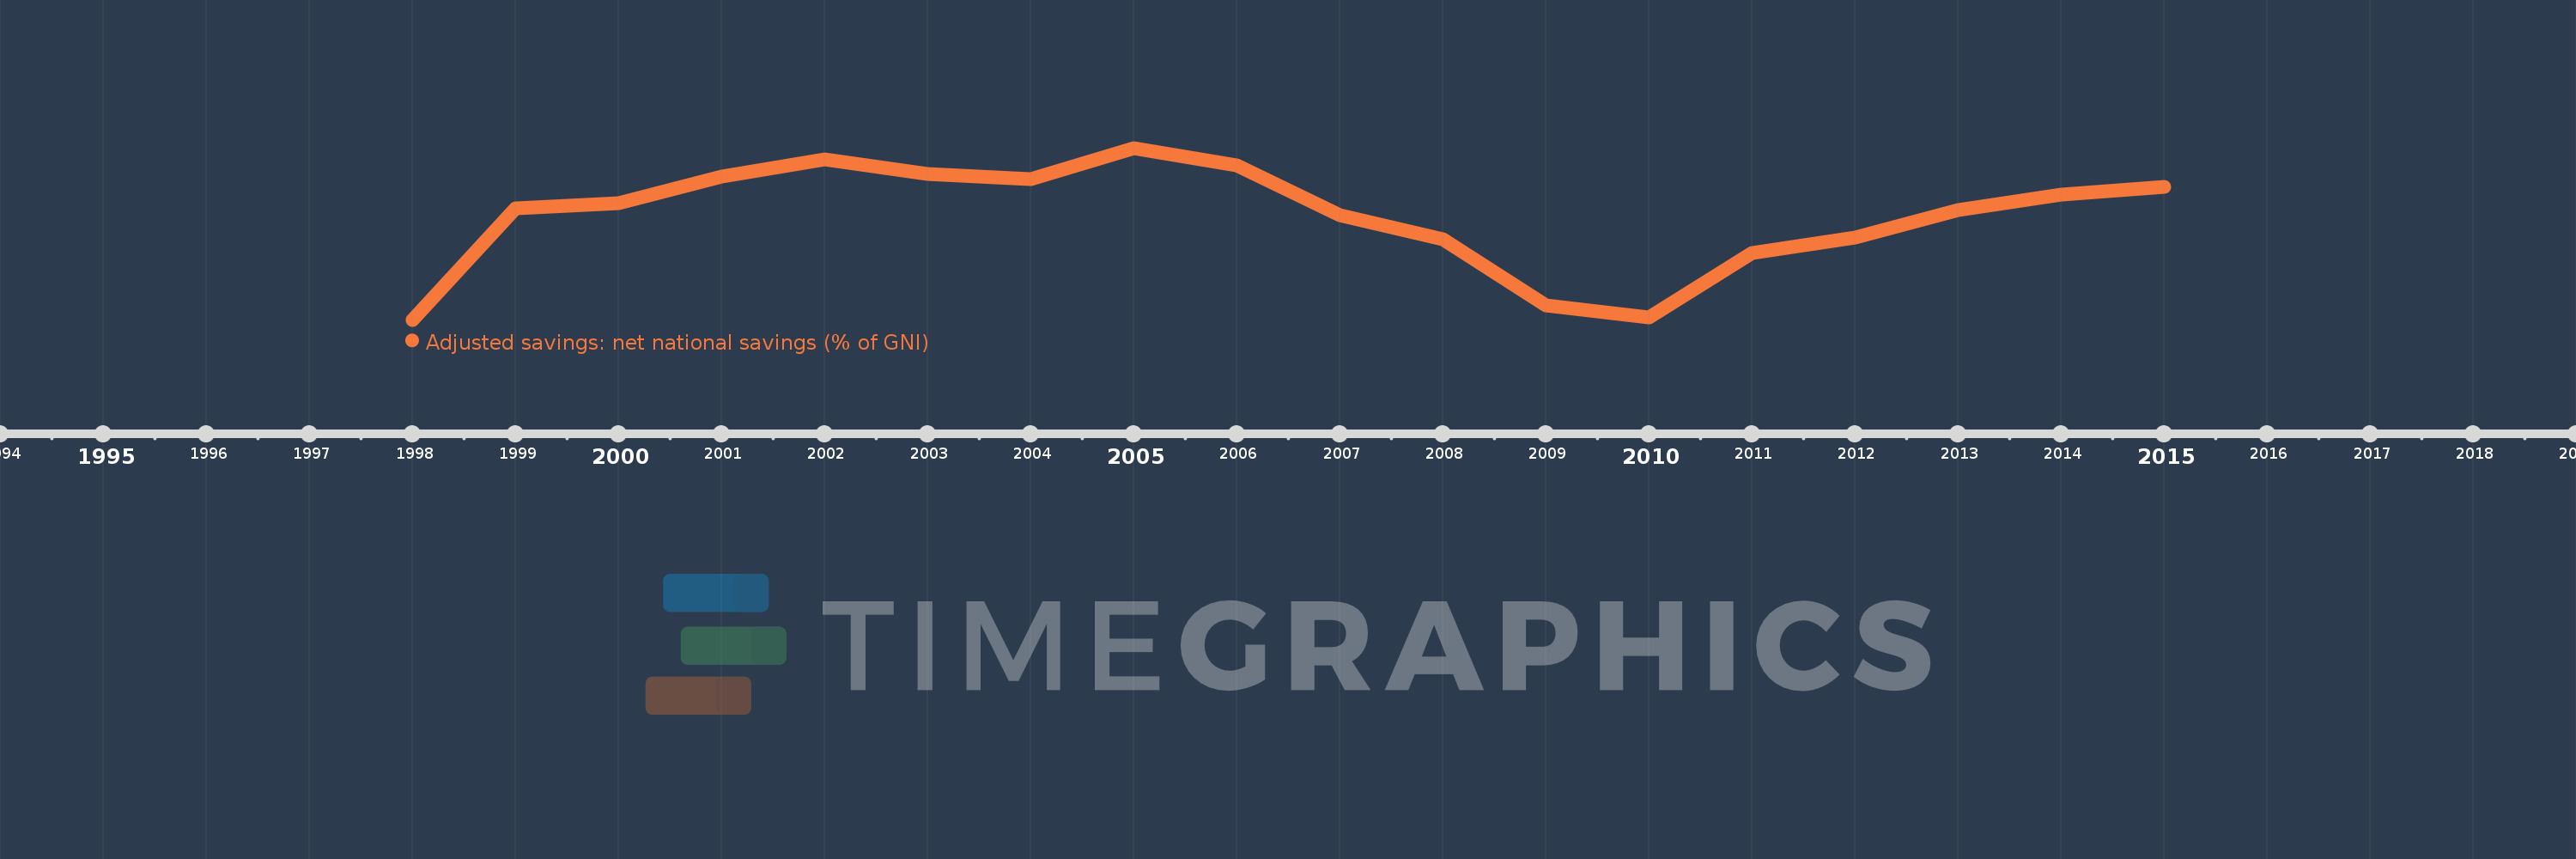
This timeline shows a graph from 1998 to 2015 of Georgia. No data until 1997. Number of actual observations by date: 18.
Source name:
World Development Indicators
Source organization:
World Bank staff estimates based on sources and methods in World Bank's "The Changing Wealth of Nations: Measuring Sustainable Development in the New Millennium" (2011).
Categories, topics:
Economy & Growth, Environment
Last updated:
apr 23, 2017
Indicators value changes by year
Meaning:
5.874
Minimum:
-7.613
jan 1, 1998
Maximum:
14.773
jan 1, 2005
At the date of observation
Value
Absolute change
Change from the previous value
jan 1, 1998
-7.613
-7.613
0.0%
jan 1, 1999
6.934
+14.547
-191.09%
jan 1, 2000
7.527
+0.593
8.55%
jan 1, 2001
11.039
+3.512
46.66%
jan 1, 2002
13.302
+2.262
20.49%
jan 1, 2003
11.411
-1.89
-14.21%
jan 1, 2004
10.695
-0.717
-6.28%
jan 1, 2005
14.773
+4.078
38.13%
jan 1, 2006
12.535
-2.238
-15.15%
jan 1, 2007
5.98
-6.554
-52.29%
jan 1, 2008
2.916
-3.064
-51.24%
jan 1, 2009
-5.738
-8.654
-296.77%
jan 1, 2010
-7.336
-1.598
27.85%
jan 1, 2011
1.134
+8.47
-115.46%
jan 1, 2012
3.064
+1.93
170.09%
jan 1, 2013
6.632
+3.568
116.44%
jan 1, 2014
8.719
+2.087
31.48%
jan 1, 2015
9.755
+1.036
11.88%
Ranking of countries by current statistics by years