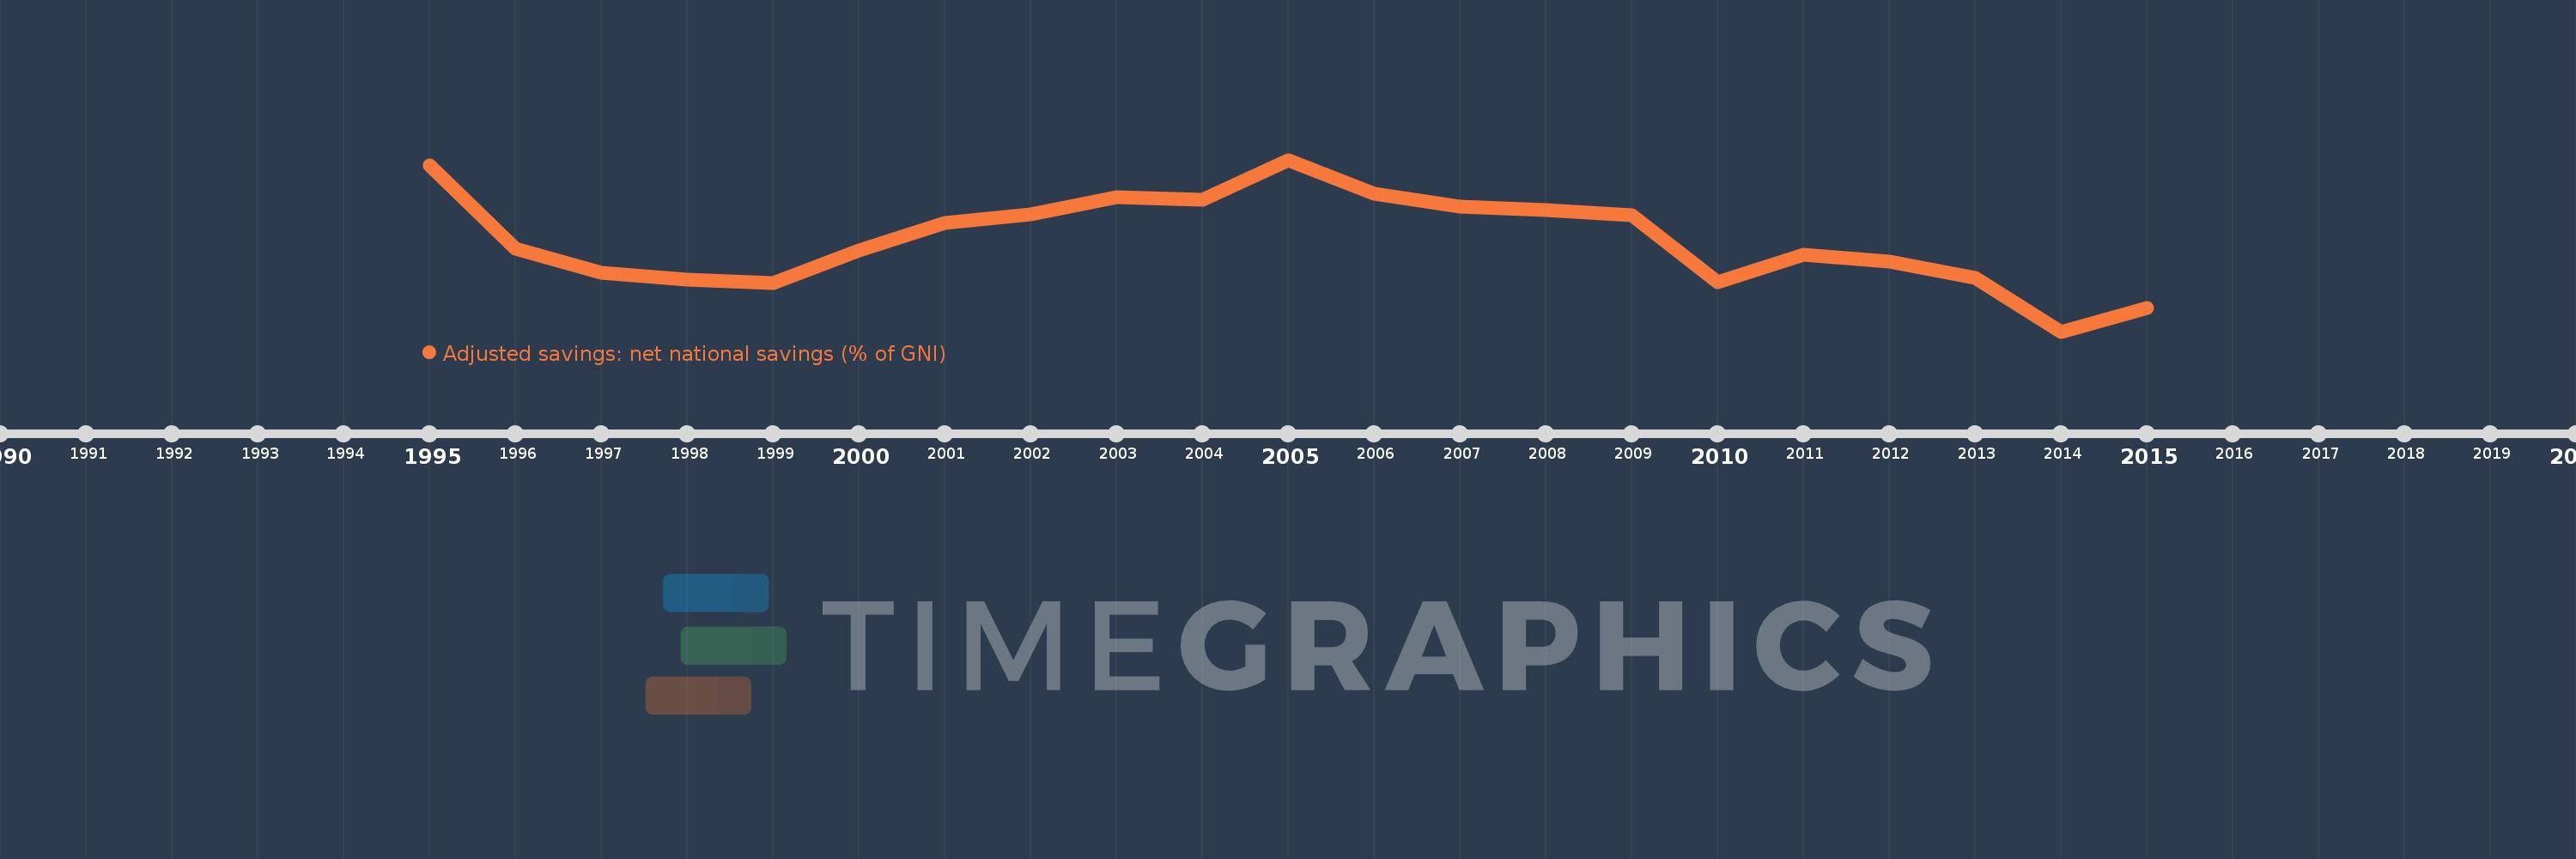
This timeline shows a graph from 1995 to 2015 of Ukraine. No data until 1994. Number of actual observations by date: 21.
Source name:
World Development Indicators
Source organization:
World Bank staff estimates based on sources and methods in World Bank's "The Changing Wealth of Nations: Measuring Sustainable Development in the New Millennium" (2011).
Categories, topics:
Economy & Growth, Environment
Last updated:
apr 23, 2017
Indicators value changes by year
Meaning:
4.998
Minimum:
-6.216
jan 1, 2014
Maximum:
14.768
jan 1, 2005
At the date of observation
Value
Absolute change
Change from the previous value
jan 1, 1995
14.105
+14.105
0.0%
jan 1, 1996
3.89
-10.215
-72.42%
jan 1, 1997
1.01
-2.88
-74.04%
jan 1, 1998
0.183
-0.827
-81.88%
jan 1, 1999
-0.316
-0.499
-272.75%
jan 1, 2000
3.664
+3.98
-1.26K%
jan 1, 2001
7.058
+3.394
92.64%
jan 1, 2002
8.129
+1.072
15.18%
jan 1, 2003
10.169
+2.039
25.09%
jan 1, 2004
9.863
-0.306
-3.01%
jan 1, 2005
14.768
+4.905
49.73%
jan 1, 2006
10.613
-4.155
-28.13%
jan 1, 2007
9.043
-1.57
-14.79%
jan 1, 2008
8.652
-0.391
-4.32%
jan 1, 2009
7.972
-0.68
-7.86%
jan 1, 2010
-0.158
-8.13
-101.98%
jan 1, 2011
3.169
+3.327
-2.11K%
jan 1, 2012
2.375
-0.794
-25.07%
jan 1, 2013
0.306
-2.069
-87.13%
jan 1, 2014
-6.216
-6.521
-2.13K%
jan 1, 2015
-3.318
+2.898
-46.62%
Ranking of countries by current statistics by years