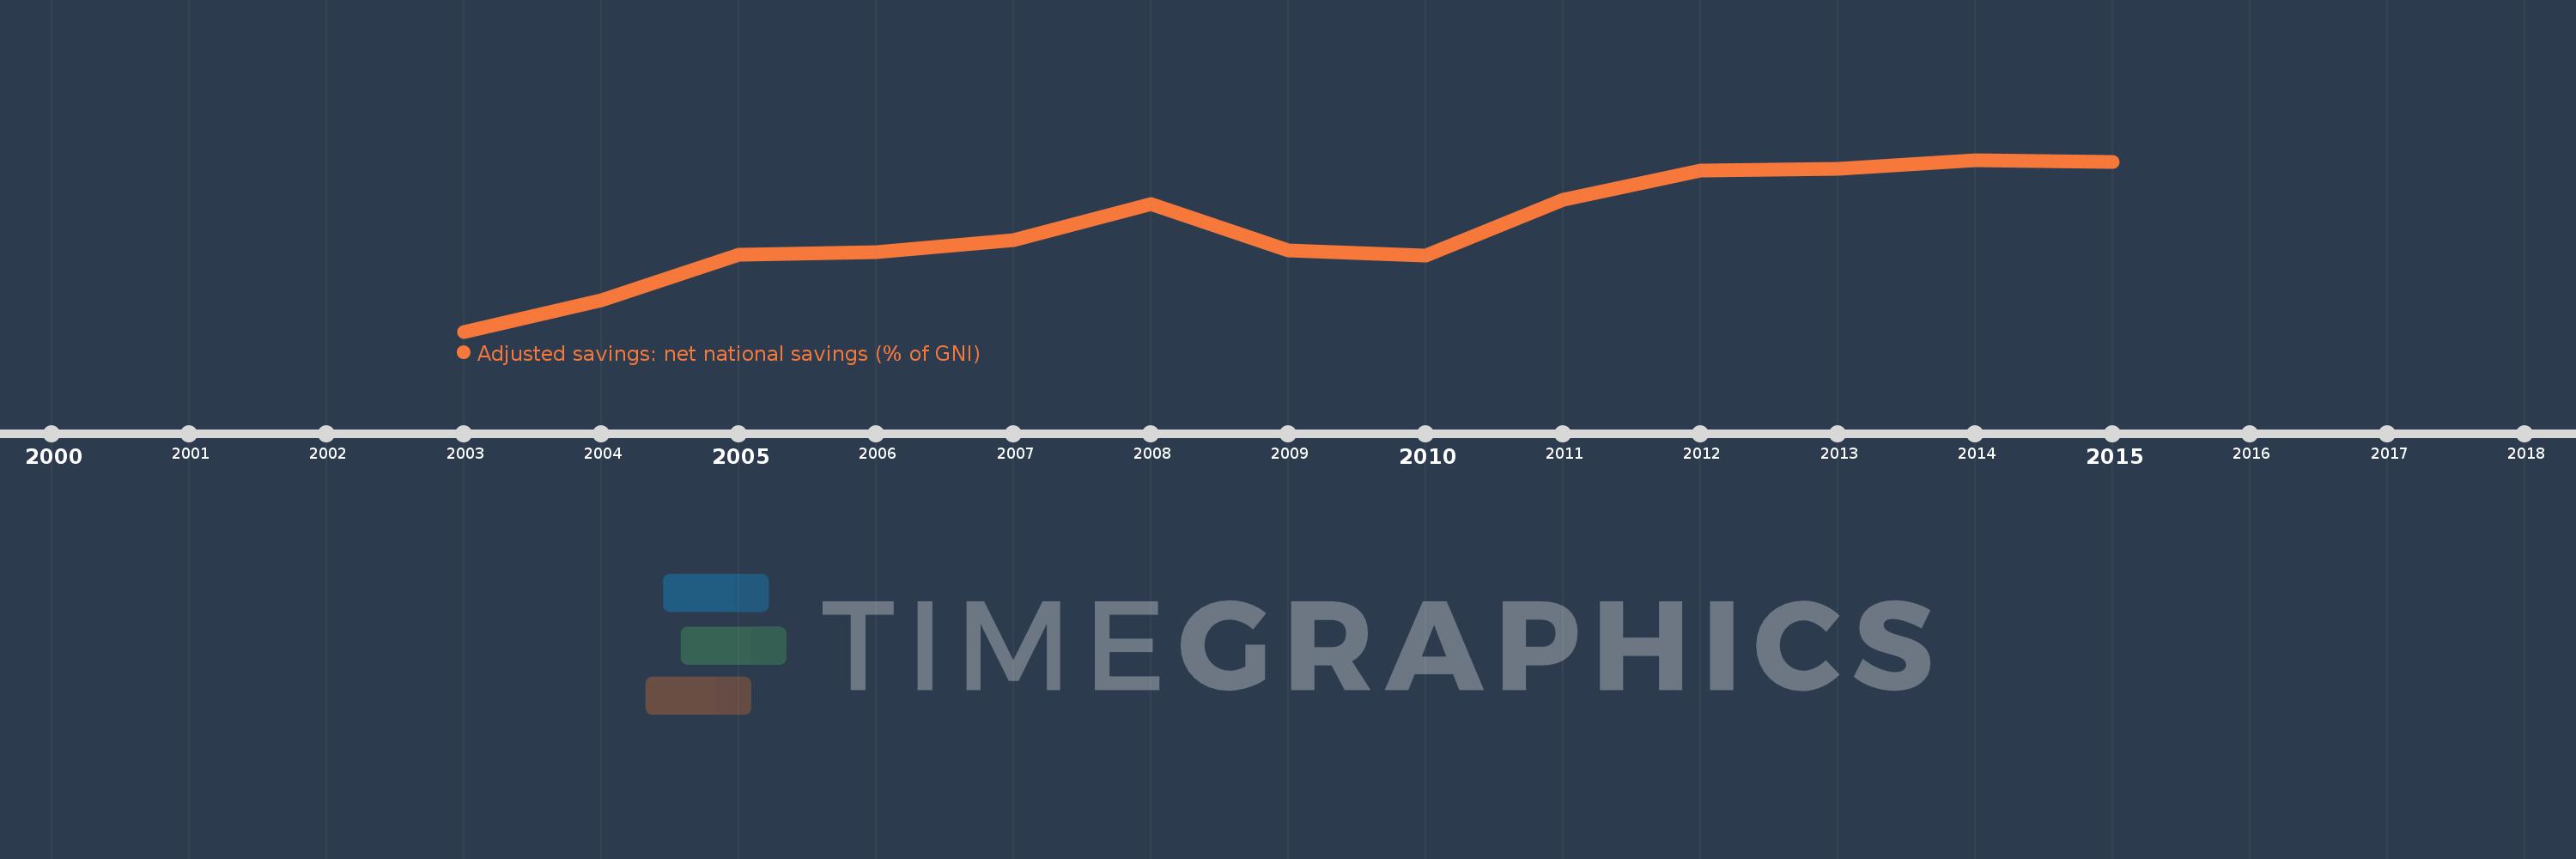
This timeline shows a graph from 2003 to 2015 of Macao SAR, China. No data until 2002. Number of actual observations by date: 13.
Source name:
World Development Indicators
Source organization:
World Bank staff estimates based on sources and methods in World Bank's "The Changing Wealth of Nations: Measuring Sustainable Development in the New Millennium" (2011).
Categories, topics:
Economy & Growth, Environment
Last updated:
apr 23, 2017
Indicators value changes by year
Meaning:
57.021
Minimum:
42.498
jan 1, 2003
Maximum:
66.316
jan 1, 2014
At the date of observation
Value
Absolute change
Change from the previous value
jan 1, 2003
42.498
+42.498
0.0%
jan 1, 2004
46.832
+4.334
10.2%
jan 1, 2005
53.134
+6.302
13.46%
jan 1, 2006
53.529
+0.395
0.74%
jan 1, 2007
55.212
+1.683
3.14%
jan 1, 2008
60.178
+4.966
8.99%
jan 1, 2009
53.802
-6.376
-10.6%
jan 1, 2010
53.056
-0.746
-1.39%
jan 1, 2011
60.829
+7.774
14.65%
jan 1, 2012
64.831
+4.002
6.58%
jan 1, 2013
65.039
+0.208
0.32%
jan 1, 2014
66.316
+1.277
1.96%
jan 1, 2015
66.011
-0.305
-0.46%
Ranking of countries by current statistics by years