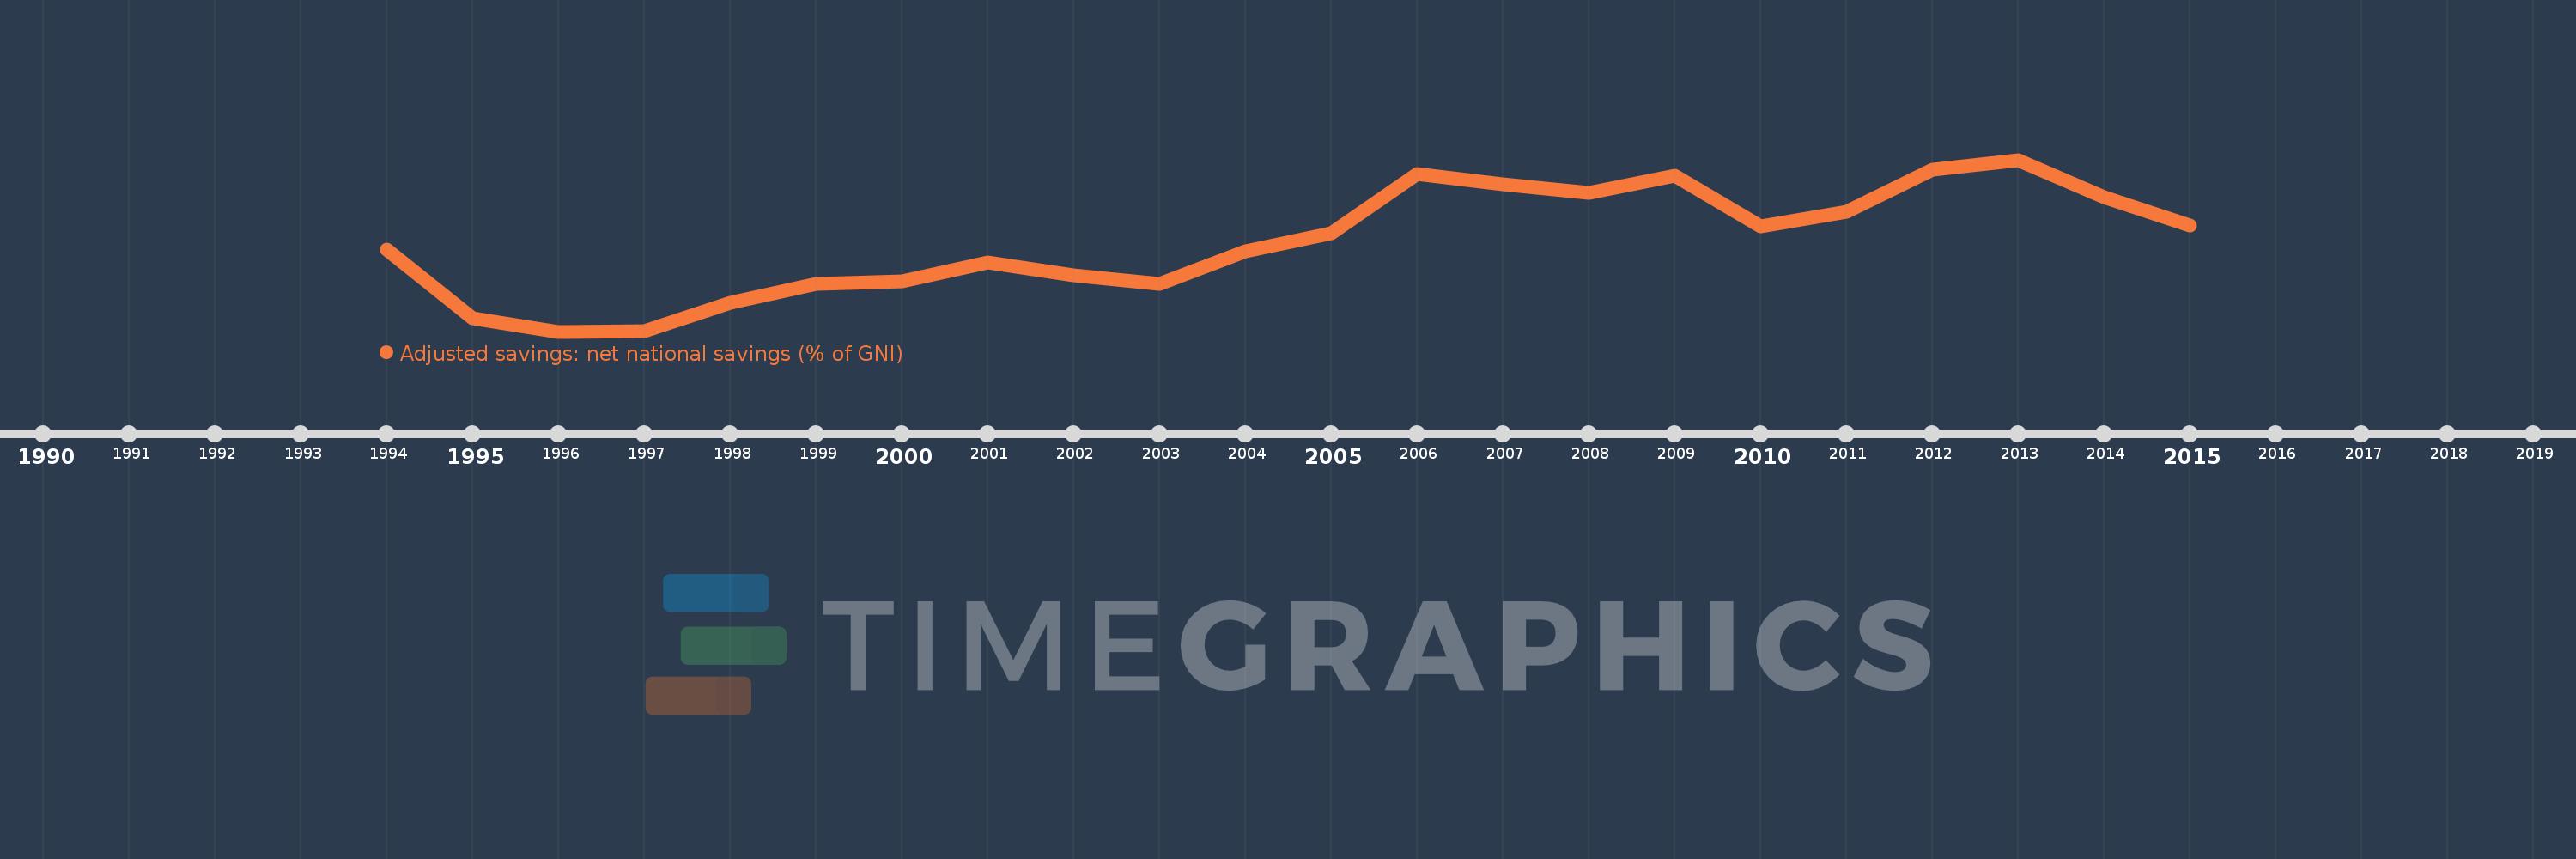
This timeline shows a graph from 1994 to 2015 of Belarus. No data until 1993. Number of actual observations by date: 22.
Source name:
World Development Indicators
Source organization:
World Bank staff estimates based on sources and methods in World Bank's "The Changing Wealth of Nations: Measuring Sustainable Development in the New Millennium" (2011).
Categories, topics:
Economy & Growth, Environment
Last updated:
apr 23, 2017
Indicators value changes by year
Meaning:
13.732
Minimum:
3.879
jan 1, 1996
Maximum:
22.731
jan 1, 2013
At the date of observation
Value
Absolute change
Change from the previous value
jan 1, 1994
12.896
+12.896
0.0%
jan 1, 1995
5.347
-7.548
-58.53%
jan 1, 1996
3.879
-1.469
-27.46%
jan 1, 1997
3.943
+0.064
1.64%
jan 1, 1998
7.072
+3.13
79.38%
jan 1, 1999
9.153
+2.081
29.42%
jan 1, 2000
9.437
+0.284
3.1%
jan 1, 2001
11.478
+2.042
21.64%
jan 1, 2002
10.084
-1.395
-12.15%
jan 1, 2003
9.156
-0.928
-9.2%
jan 1, 2004
12.682
+3.526
38.51%
jan 1, 2005
14.682
+2.0
15.77%
jan 1, 2006
21.199
+6.517
44.39%
jan 1, 2007
20.042
-1.157
-5.46%
jan 1, 2008
19.142
-0.9
-4.49%
jan 1, 2009
20.986
+1.844
9.63%
jan 1, 2010
15.395
-5.591
-26.64%
jan 1, 2011
17.008
+1.612
10.47%
jan 1, 2012
21.635
+4.627
27.21%
jan 1, 2013
22.731
+1.096
5.07%
jan 1, 2014
18.65
-4.08
-17.95%
jan 1, 2015
15.508
-3.142
-16.85%
Ranking of countries by current statistics by years