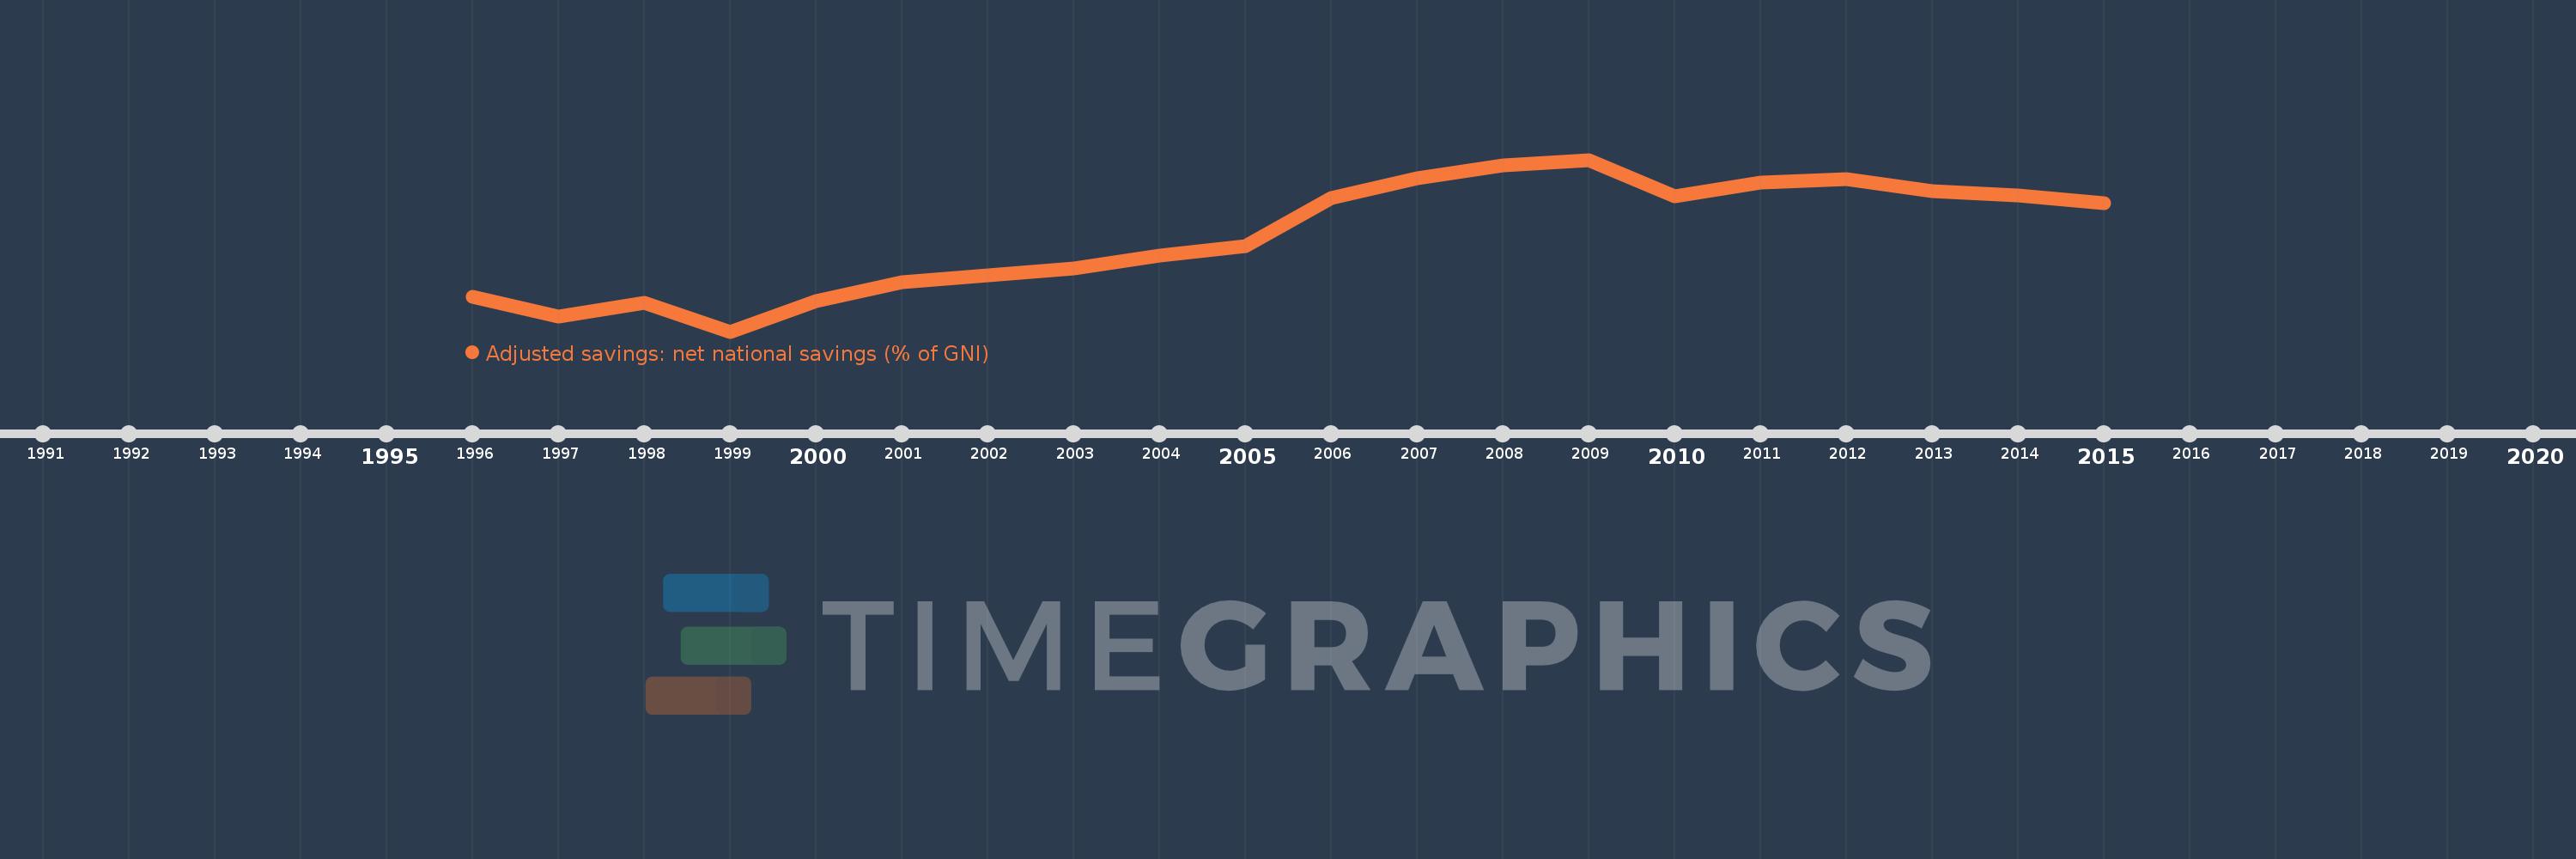
This timeline shows a graph from 1996 to 2015 of Azerbaijan. No data until 1995. Number of actual observations by date: 20.
Source name:
World Development Indicators
Source organization:
World Bank staff estimates based on sources and methods in World Bank's "The Changing Wealth of Nations: Measuring Sustainable Development in the New Millennium" (2011).
Categories, topics:
Economy & Growth, Environment
Last updated:
apr 23, 2017
Indicators value changes by year
Meaning:
22.824
Minimum:
-14.097
jan 1, 1999
Maximum:
52.503
jan 1, 2009
At the date of observation
Value
Absolute change
Change from the previous value
jan 1, 1996
-0.713
-0.713
0.0%
jan 1, 1997
-8.201
-7.489
1.05K%
jan 1, 1998
-2.955
+5.246
-63.97%
jan 1, 1999
-14.097
-11.142
377.05%
jan 1, 2000
-2.187
+11.91
-84.49%
jan 1, 2001
5.085
+7.271
-332.52%
jan 1, 2002
7.858
+2.773
54.54%
jan 1, 2003
10.216
+2.359
30.02%
jan 1, 2004
15.334
+5.118
50.09%
jan 1, 2005
19.023
+3.689
24.06%
jan 1, 2006
37.525
+18.502
97.26%
jan 1, 2007
45.221
+7.696
20.51%
jan 1, 2008
50.468
+5.247
11.6%
jan 1, 2009
52.503
+2.035
4.03%
jan 1, 2010
38.237
-14.267
-27.17%
jan 1, 2011
43.531
+5.294
13.85%
jan 1, 2012
44.958
+1.427
3.28%
jan 1, 2013
40.455
-4.503
-10.02%
jan 1, 2014
38.539
-1.917
-4.74%
jan 1, 2015
35.675
-2.864
-7.43%
Ranking of countries by current statistics by years