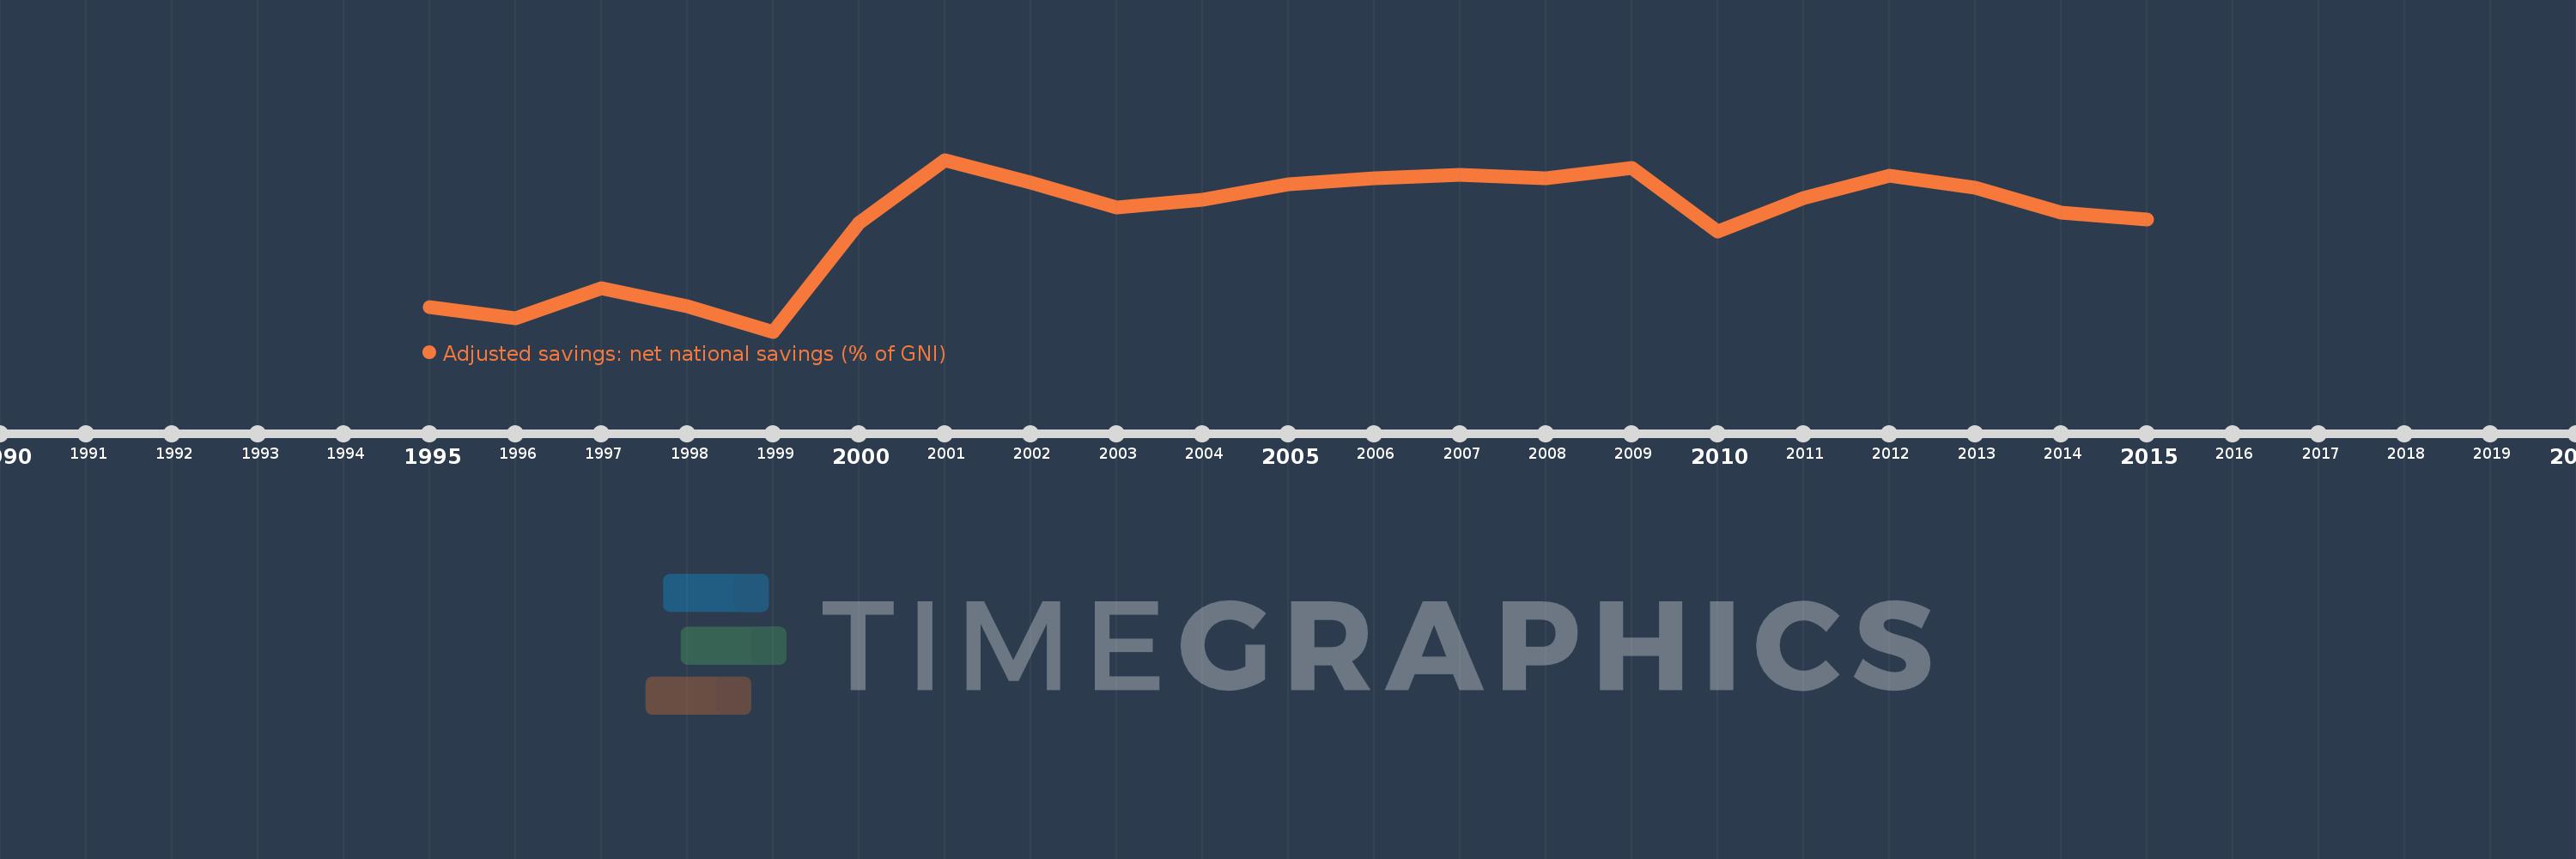
This timeline shows a graph from 1995 to 2015 of Russian Federation. No data until 1994. Number of actual observations by date: 21.
Source name:
World Development Indicators
Source organization:
World Bank staff estimates based on sources and methods in World Bank's "The Changing Wealth of Nations: Measuring Sustainable Development in the New Millennium" (2011).
Categories, topics:
Economy & Growth, Environment
Last updated:
apr 23, 2017
Indicators value changes by year
Meaning:
19.253
Minimum:
1.989
jan 1, 1999
Maximum:
28.695
jan 1, 2001
At the date of observation
Value
Absolute change
Change from the previous value
jan 1, 1995
5.81
+5.81
0.0%
jan 1, 1996
4.024
-1.786
-30.73%
jan 1, 1997
8.749
+4.725
117.4%
jan 1, 1998
5.955
-2.794
-31.93%
jan 1, 1999
1.989
-3.966
-66.6%
jan 1, 2000
18.945
+16.956
852.4%
jan 1, 2001
28.695
+9.75
51.47%
jan 1, 2002
25.195
-3.5
-12.2%
jan 1, 2003
21.305
-3.891
-15.44%
jan 1, 2004
22.508
+1.204
5.65%
jan 1, 2005
24.908
+2.4
10.66%
jan 1, 2006
25.788
+0.88
3.53%
jan 1, 2007
26.404
+0.616
2.39%
jan 1, 2008
25.832
-0.572
-2.17%
jan 1, 2009
27.466
+1.634
6.33%
jan 1, 2010
17.488
-9.978
-36.33%
jan 1, 2011
22.782
+5.294
30.28%
jan 1, 2012
26.208
+3.426
15.04%
jan 1, 2013
24.407
-1.801
-6.87%
jan 1, 2014
20.466
-3.94
-16.14%
jan 1, 2015
19.385
-1.081
-5.28%
Ranking of countries by current statistics by years