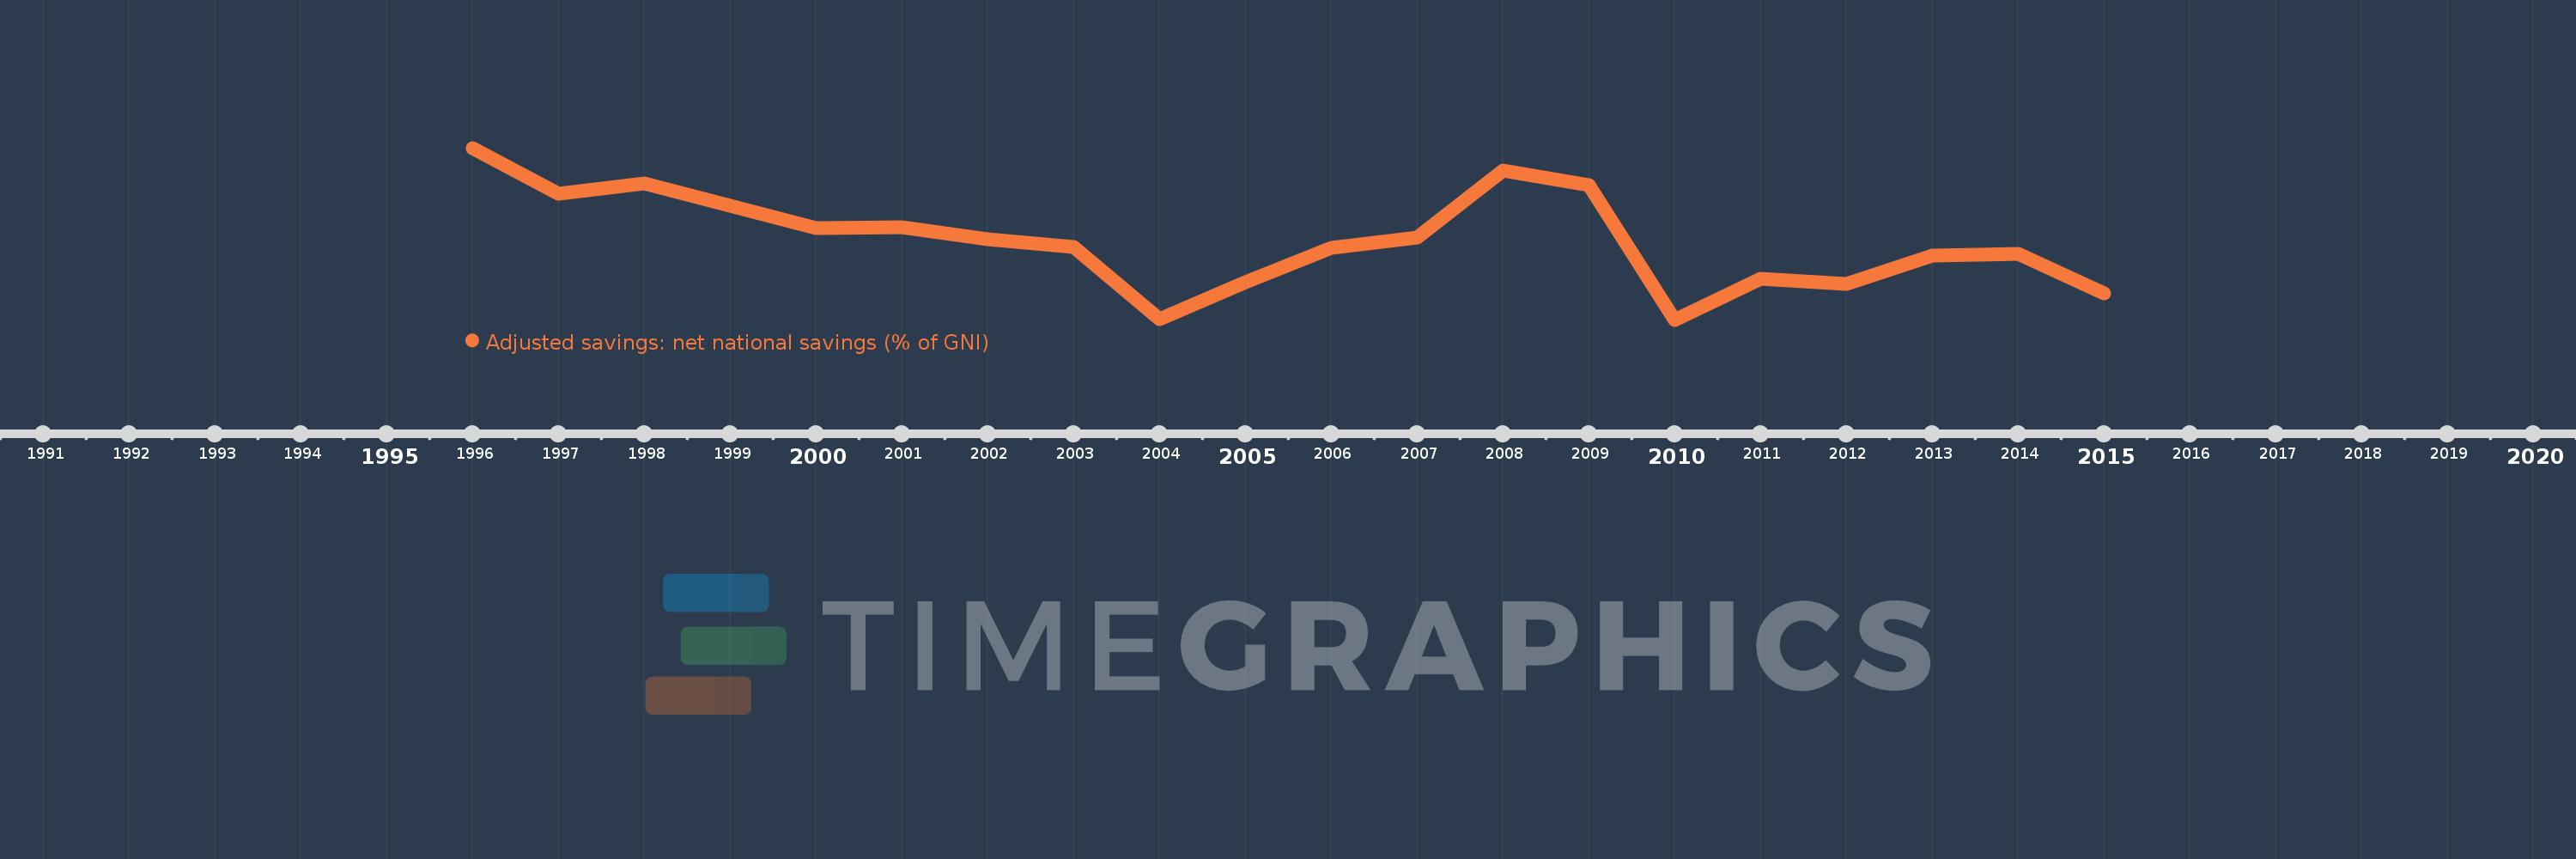
This timeline shows a graph from 1996 to 2015 of Slovak Republic. No data until 1995. Number of actual observations by date: 20.
Source name:
World Development Indicators
Source organization:
World Bank staff estimates based on sources and methods in World Bank's "The Changing Wealth of Nations: Measuring Sustainable Development in the New Millennium" (2011).
Categories, topics:
Economy & Growth, Environment
Last updated:
apr 23, 2017
Indicators value changes by year
Meaning:
1.845
Minimum:
-2.673
jan 1, 2010
Maximum:
7.065
jan 1, 1996
At the date of observation
Value
Absolute change
Change from the previous value
jan 1, 1996
7.065
+7.065
0.0%
jan 1, 1997
4.471
-2.594
-36.71%
jan 1, 1998
5.073
+0.602
13.47%
jan 1, 1999
3.798
-1.275
-25.13%
jan 1, 2000
2.5
-1.298
-34.18%
jan 1, 2001
2.591
+0.091
3.65%
jan 1, 2002
1.869
-0.722
-27.86%
jan 1, 2003
1.447
-0.422
-22.6%
jan 1, 2004
-2.653
-4.1
-283.4%
jan 1, 2005
-0.533
+2.121
-79.92%
jan 1, 2006
1.382
+1.915
-359.42%
jan 1, 2007
1.993
+0.611
44.22%
jan 1, 2008
5.764
+3.77
189.13%
jan 1, 2009
4.95
-0.814
-14.12%
jan 1, 2010
-2.673
-7.623
-154.0%
jan 1, 2011
-0.354
+2.319
-86.76%
jan 1, 2012
-0.628
-0.274
77.48%
jan 1, 2013
0.98
+1.608
-256.16%
jan 1, 2014
1.038
+0.057
5.85%
jan 1, 2015
-1.187
-2.225
-214.36%
Ranking of countries by current statistics by years