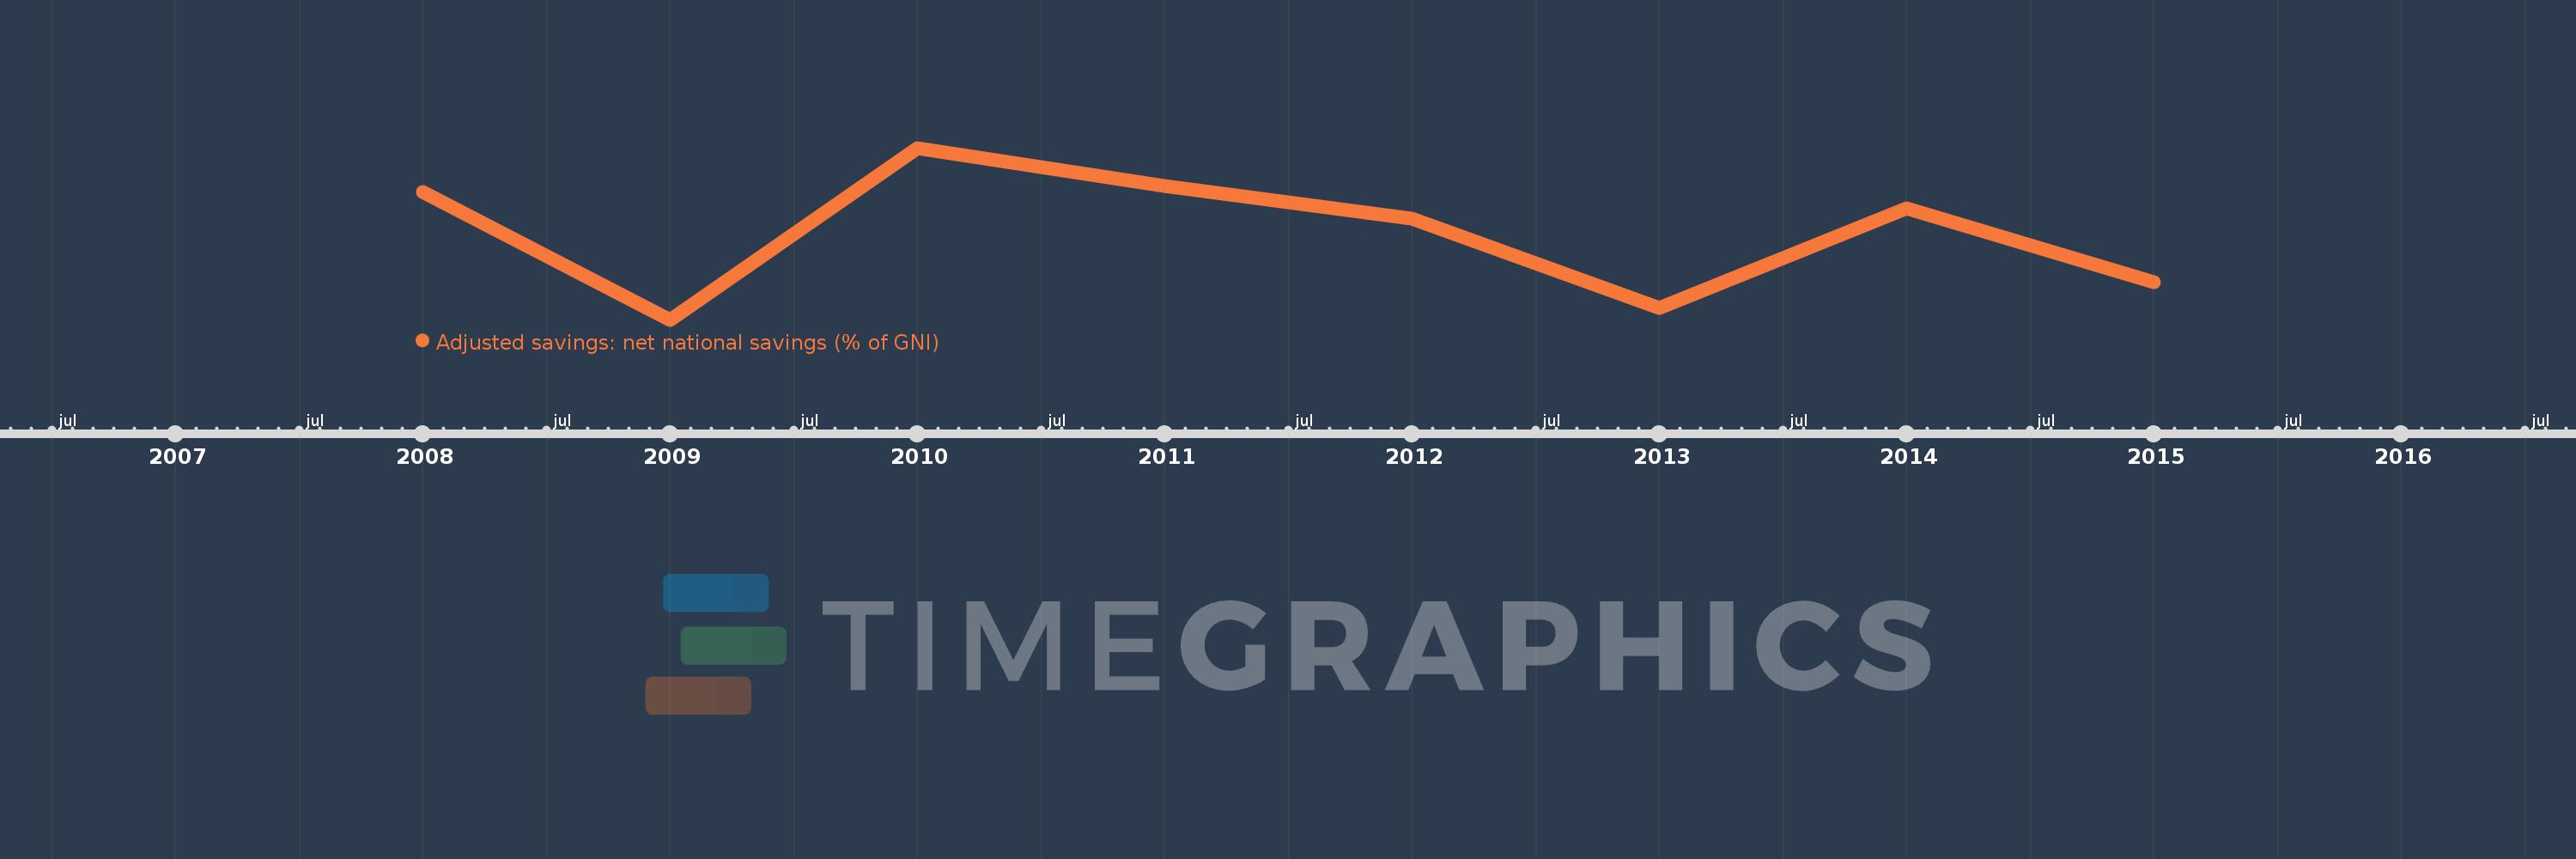
This timeline shows a graph from 2008 to 2015 of Serbia. No data until 2007. Number of actual observations by date: 8.
Source name:
World Development Indicators
Source organization:
World Bank staff estimates based on sources and methods in World Bank's "The Changing Wealth of Nations: Measuring Sustainable Development in the New Millennium" (2011).
Categories, topics:
Economy & Growth, Environment
Last updated:
apr 23, 2017
Indicators value changes by year
Meaning:
-4.094
Minimum:
-5.622
jan 1, 2009
Maximum:
-2.602
jan 1, 2010
At the date of observation
Value
Absolute change
Change from the previous value
jan 1, 2008
-3.375
-3.375
0.0%
jan 1, 2009
-5.622
-2.247
66.58%
jan 1, 2010
-2.602
+3.02
-53.72%
jan 1, 2011
-3.264
-0.662
25.44%
jan 1, 2012
-3.842
-0.578
17.7%
jan 1, 2013
-5.415
-1.573
40.95%
jan 1, 2014
-3.664
+1.751
-32.33%
jan 1, 2015
-4.967
-1.303
35.55%
Ranking of countries by current statistics by years