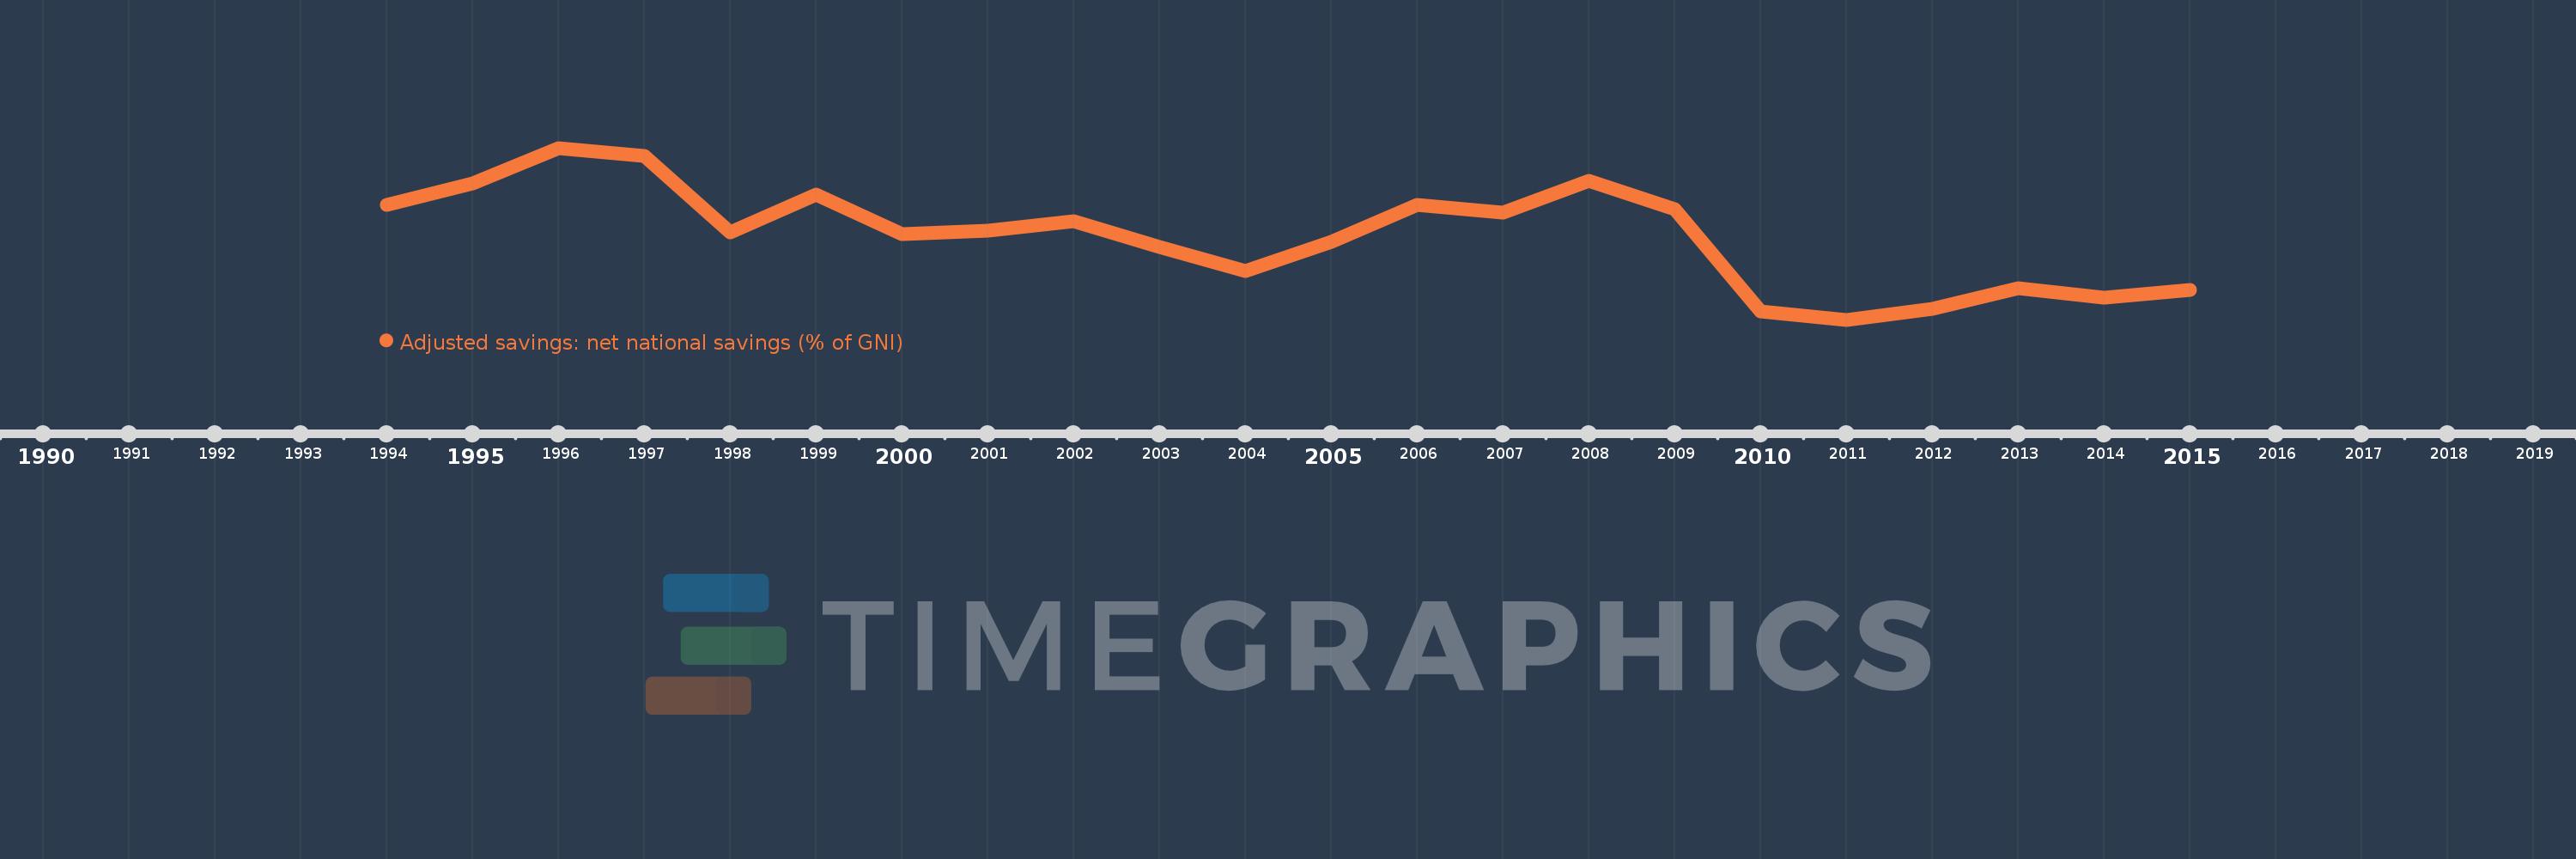
This timeline shows a graph from 1994 to 2015 of Czech Republic. No data until 1993. Number of actual observations by date: 22.
Source name:
World Development Indicators
Source organization:
World Bank staff estimates based on sources and methods in World Bank's "The Changing Wealth of Nations: Measuring Sustainable Development in the New Millennium" (2011).
Categories, topics:
Economy & Growth, Environment
Last updated:
apr 23, 2017
Indicators value changes by year
Meaning:
5.372
Minimum:
1.062
jan 1, 2011
Maximum:
9.886
jan 1, 1996
At the date of observation
Value
Absolute change
Change from the previous value
jan 1, 1994
6.964
+6.964
0.0%
jan 1, 1995
8.059
+1.095
15.72%
jan 1, 1996
9.886
+1.827
22.68%
jan 1, 1997
9.463
-0.423
-4.28%
jan 1, 1998
5.571
-3.892
-41.13%
jan 1, 1999
7.511
+1.94
34.83%
jan 1, 2000
5.457
-2.054
-27.35%
jan 1, 2001
5.648
+0.191
3.51%
jan 1, 2002
6.106
+0.458
8.11%
jan 1, 2003
4.797
-1.309
-21.44%
jan 1, 2004
3.559
-1.237
-25.8%
jan 1, 2005
5.061
+1.502
42.21%
jan 1, 2006
6.964
+1.903
37.59%
jan 1, 2007
6.57
-0.395
-5.67%
jan 1, 2008
8.207
+1.637
24.92%
jan 1, 2009
6.728
-1.479
-18.02%
jan 1, 2010
1.509
-5.219
-77.57%
jan 1, 2011
1.062
-0.446
-29.59%
jan 1, 2012
1.613
+0.551
51.84%
jan 1, 2013
2.662
+1.049
65.0%
jan 1, 2014
2.182
-0.48
-18.02%
jan 1, 2015
2.598
+0.415
19.04%
Ranking of countries by current statistics by years