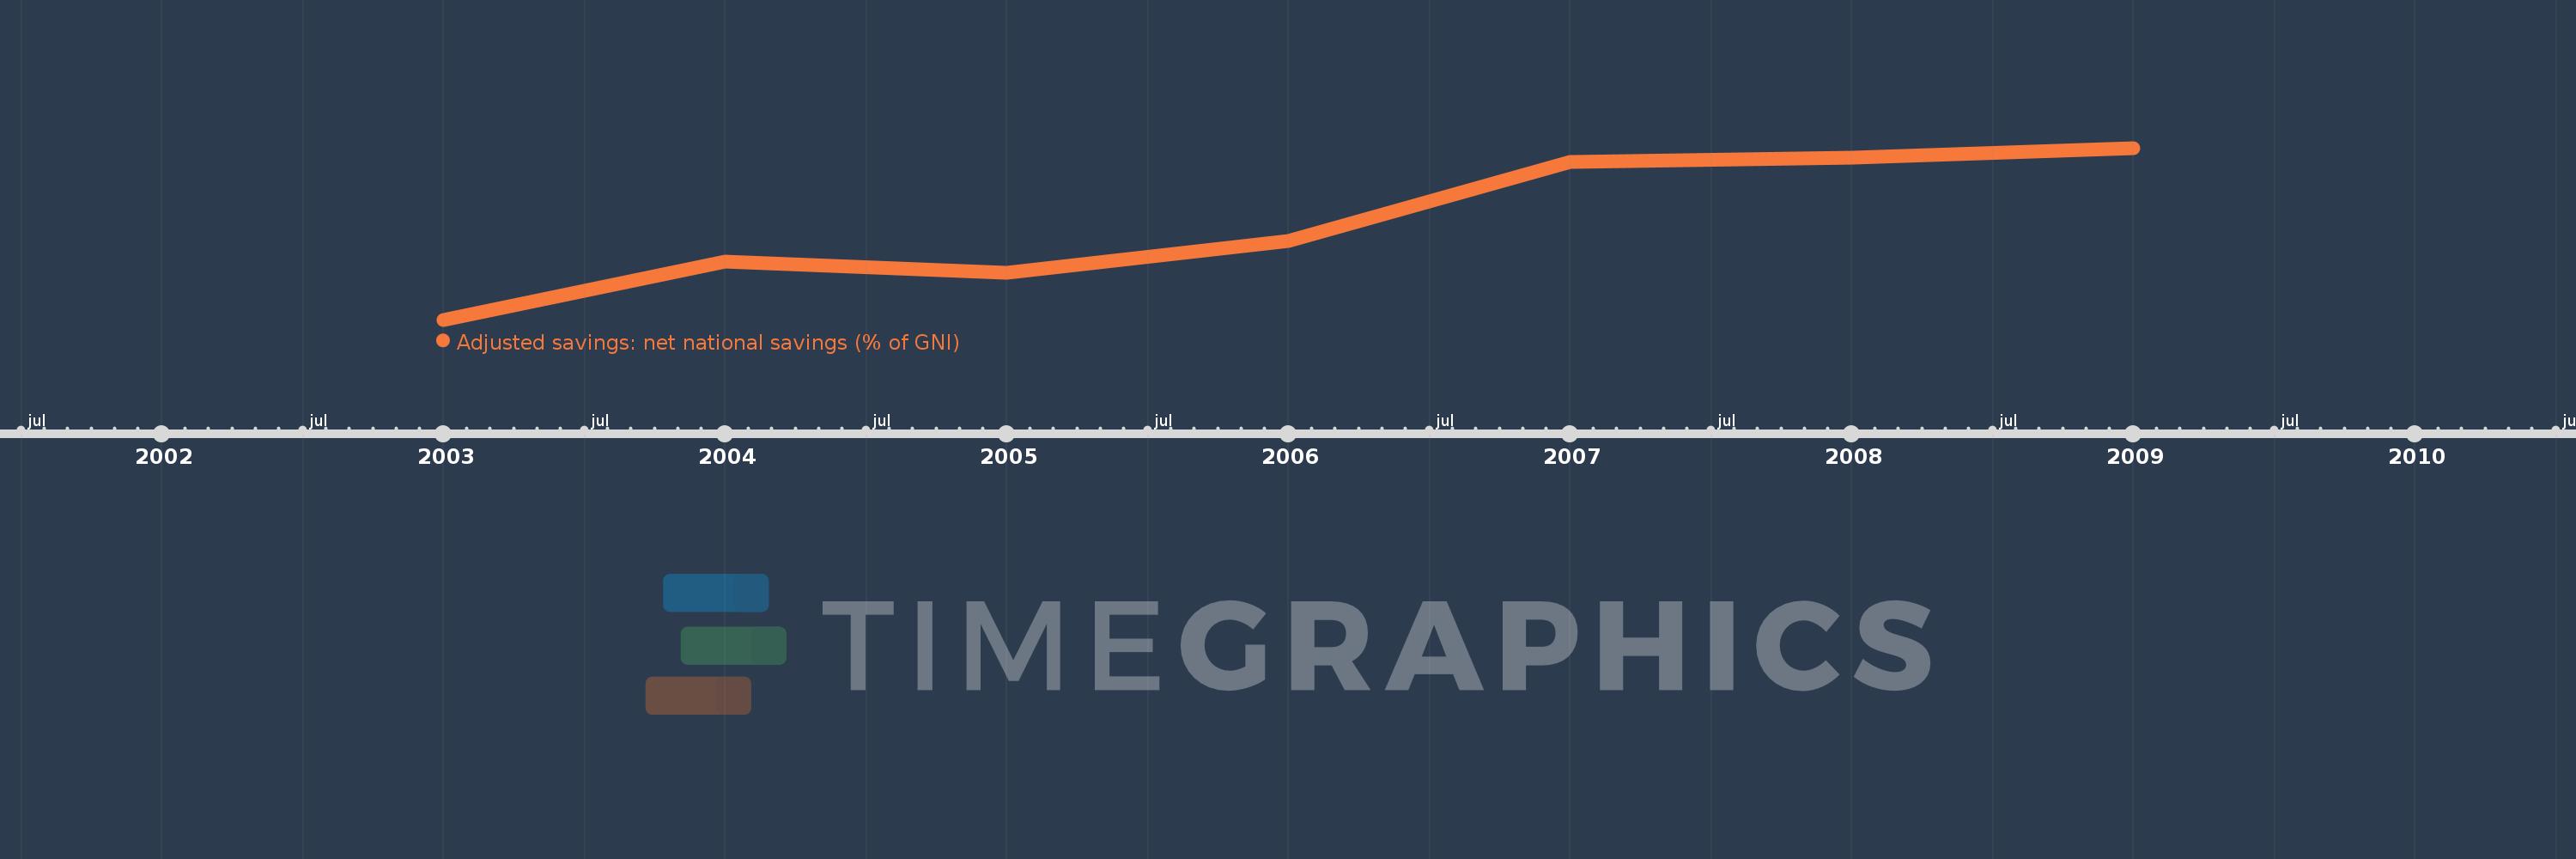
This timeline shows a graph from 2003 to 2009 of Libya. No data until 2002. Number of actual observations by date: 7.
Source name:
World Development Indicators
Source organization:
World Bank staff estimates based on sources and methods in World Bank's "The Changing Wealth of Nations: Measuring Sustainable Development in the New Millennium" (2011).
Categories, topics:
Economy & Growth, Environment
Last updated:
apr 23, 2017
Indicators value changes by year
Meaning:
41.322
Minimum:
12.328
jan 1, 2003
Maximum:
64.018
jan 1, 2009
At the date of observation
Value
Absolute change
Change from the previous value
jan 1, 2003
12.328
+12.328
0.0%
jan 1, 2004
29.789
+17.46
141.63%
jan 1, 2005
26.368
-3.421
-11.48%
jan 1, 2006
36.035
+9.667
36.66%
jan 1, 2007
59.743
+23.708
65.79%
jan 1, 2008
60.972
+1.228
2.06%
jan 1, 2009
64.018
+3.047
5.0%
Ranking of countries by current statistics by years