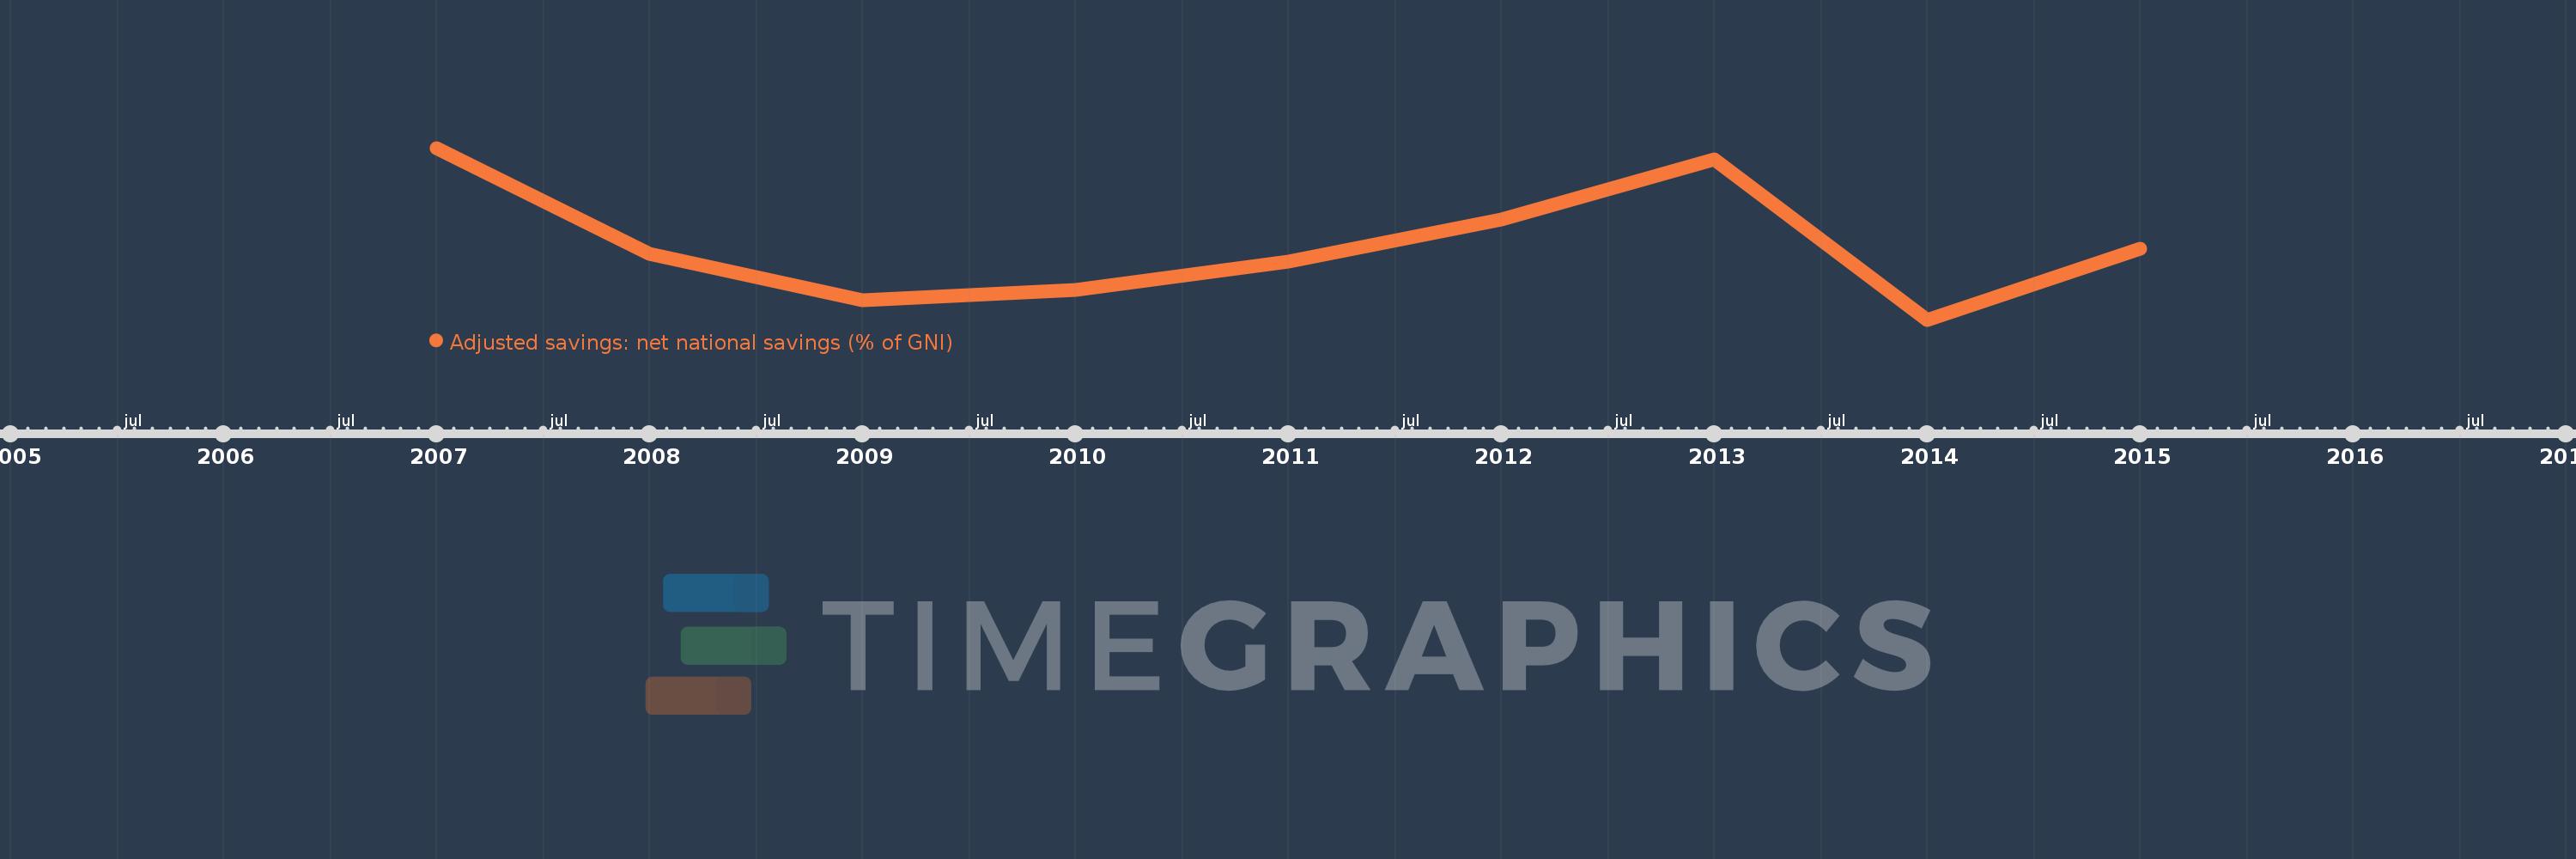
This timeline shows a graph from 2007 to 2015 of Bhutan. No data until 2006. Number of actual observations by date: 9.
Source name:
World Development Indicators
Source organization:
World Bank staff estimates based on sources and methods in World Bank's "The Changing Wealth of Nations: Measuring Sustainable Development in the New Millennium" (2011).
Categories, topics:
Economy & Growth, Environment
Last updated:
apr 23, 2017
Indicators value changes by year
Meaning:
30.125
Minimum:
18.306
jan 1, 2014
Maximum:
45.28
jan 1, 2007
At the date of observation
Value
Absolute change
Change from the previous value
jan 1, 2007
45.28
+45.28
0.0%
jan 1, 2008
28.694
-16.585
-36.63%
jan 1, 2009
21.331
-7.364
-25.66%
jan 1, 2010
23.021
+1.691
7.93%
jan 1, 2011
27.451
+4.43
19.24%
jan 1, 2012
34.081
+6.63
24.15%
jan 1, 2013
43.476
+9.395
27.57%
jan 1, 2014
18.306
-25.17
-57.89%
jan 1, 2015
29.485
+11.179
61.07%
Ranking of countries by current statistics by years