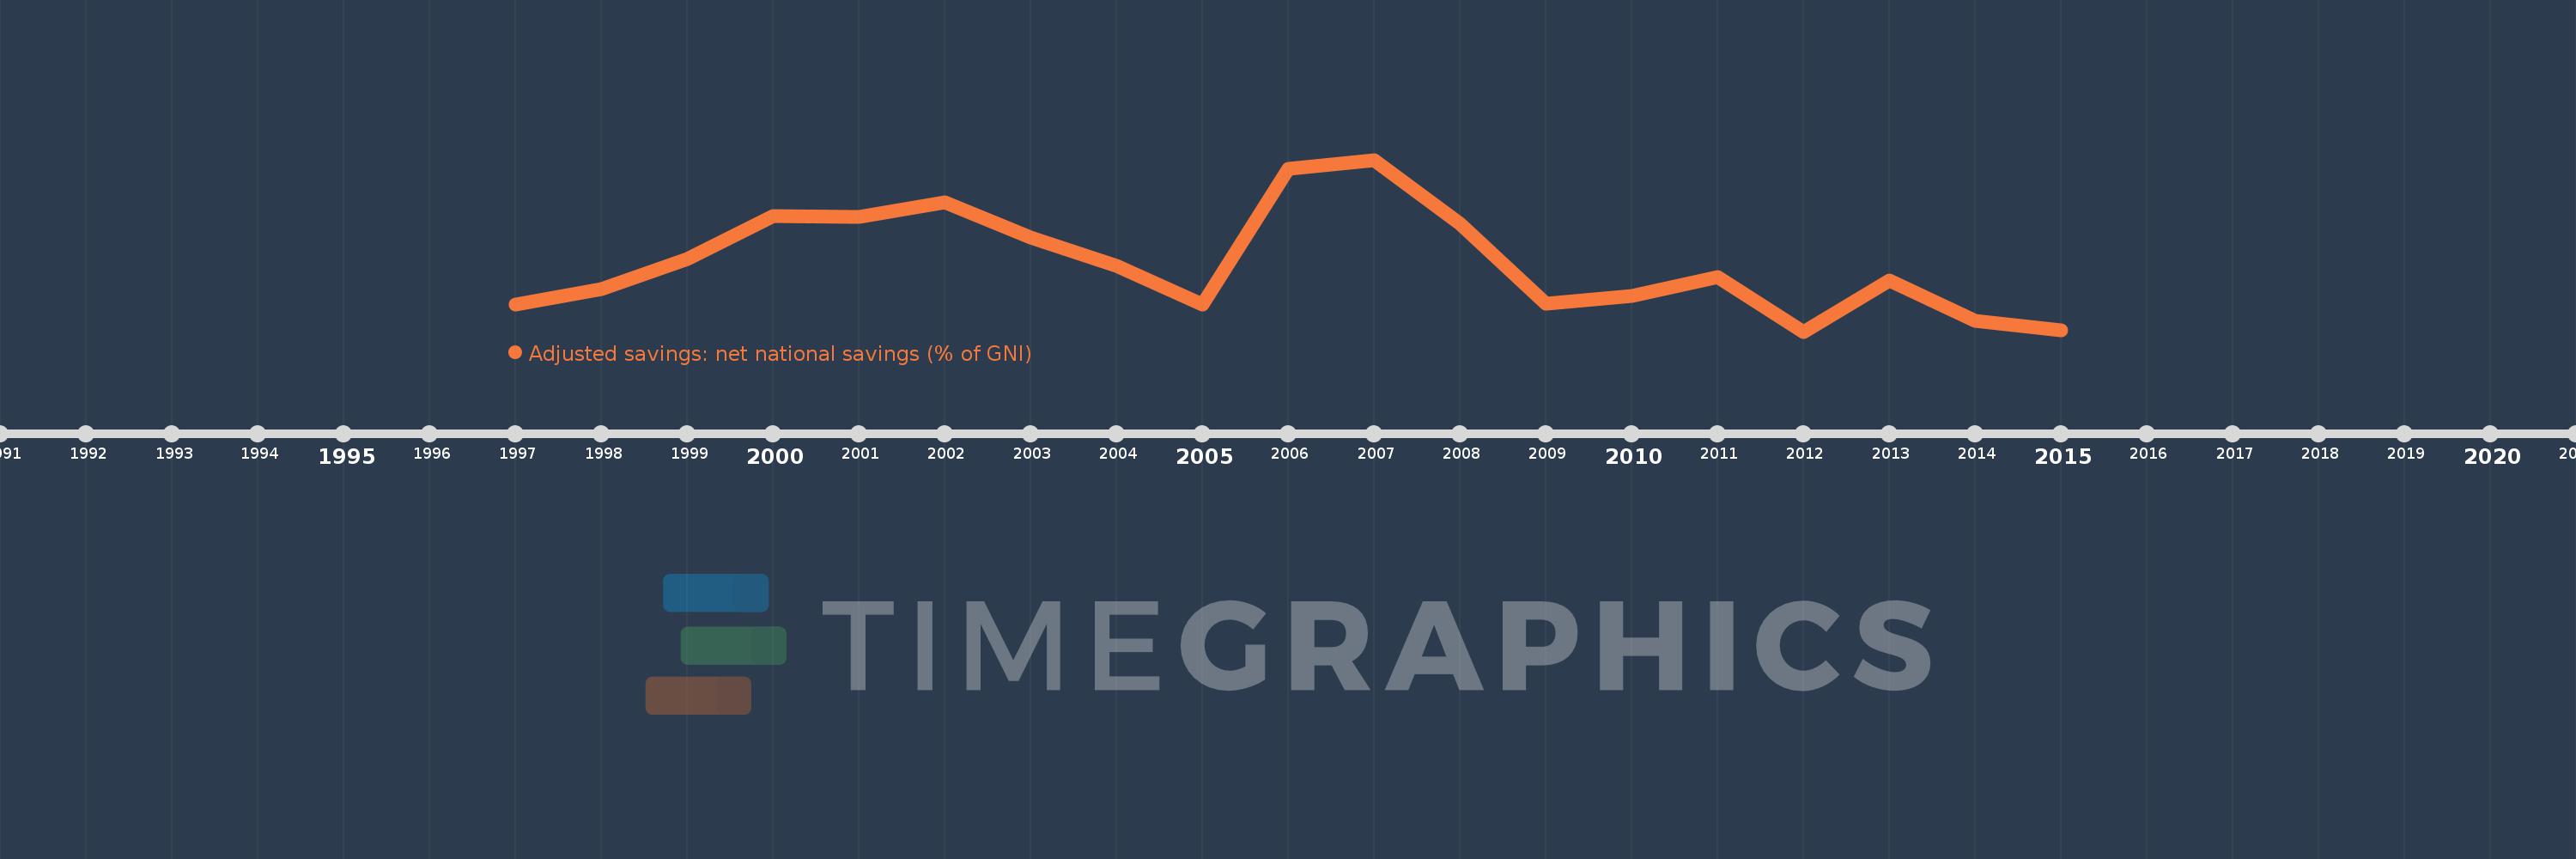
This timeline shows a graph from 1997 to 2015 of Vietnam. No data until 1996. Number of actual observations by date: 19.
Source name:
World Development Indicators
Source organization:
World Bank staff estimates based on sources and methods in World Bank's "The Changing Wealth of Nations: Measuring Sustainable Development in the New Millennium" (2011).
Categories, topics:
Economy & Growth, Environment
Last updated:
apr 23, 2017
Indicators value changes by year
Meaning:
19.886
Minimum:
15.114
jan 1, 2012
Maximum:
26.972
jan 1, 2007
At the date of observation
Value
Absolute change
Change from the previous value
jan 1, 1997
16.964
+16.964
0.0%
jan 1, 1998
18.066
+1.102
6.5%
jan 1, 1999
20.15
+2.084
11.54%
jan 1, 2000
23.085
+2.934
14.56%
jan 1, 2001
23.042
-0.043
-0.18%
jan 1, 2002
24.065
+1.023
4.44%
jan 1, 2003
21.597
-2.468
-10.26%
jan 1, 2004
19.659
-1.939
-8.98%
jan 1, 2005
17.006
-2.653
-13.5%
jan 1, 2006
26.344
+9.339
54.92%
jan 1, 2007
26.972
+0.628
2.38%
jan 1, 2008
22.555
-4.416
-16.37%
jan 1, 2009
17.062
-5.494
-24.36%
jan 1, 2010
17.546
+0.484
2.84%
jan 1, 2011
18.872
+1.326
7.56%
jan 1, 2012
15.114
-3.758
-19.91%
jan 1, 2013
18.648
+3.533
23.38%
jan 1, 2014
15.872
-2.776
-14.89%
jan 1, 2015
15.217
-0.655
-4.13%
Ranking of countries by current statistics by years