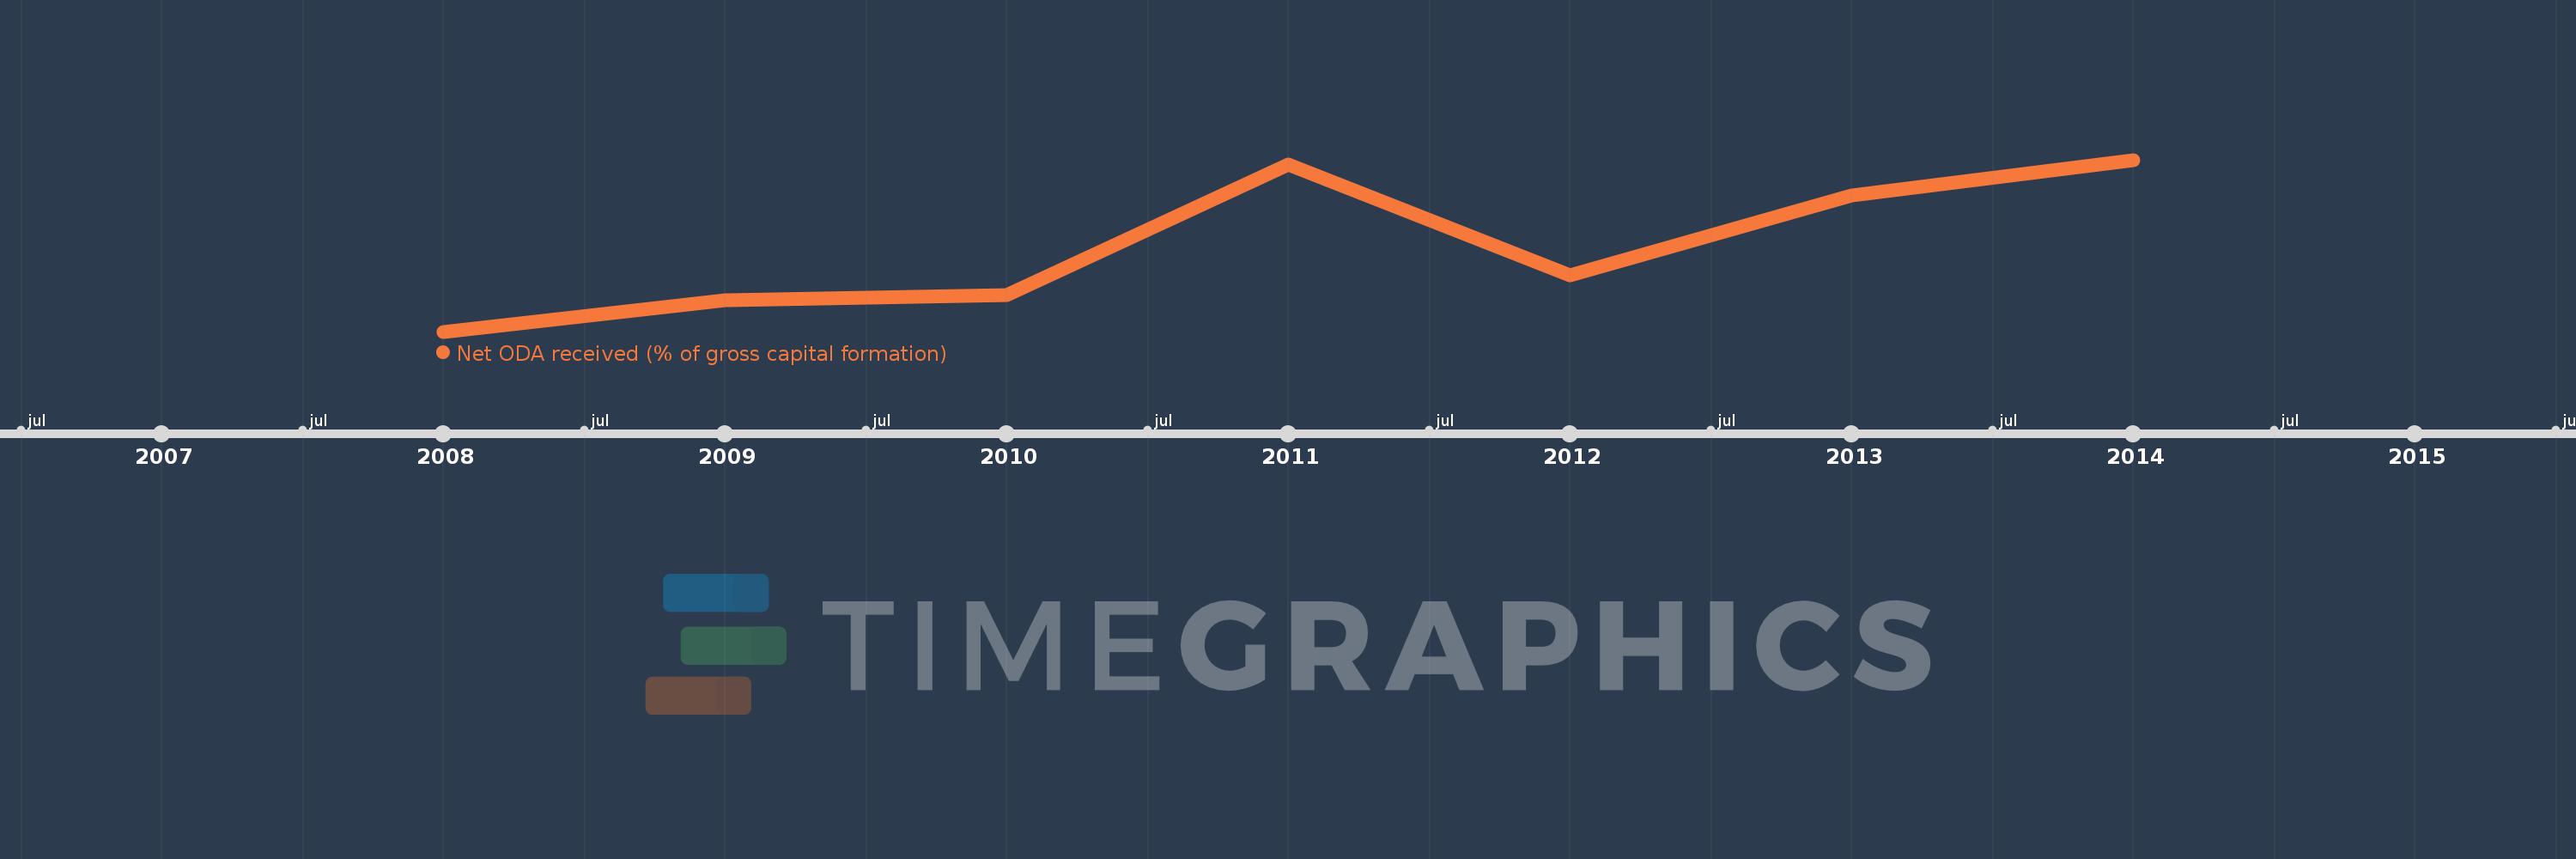
This timeline shows a graph from 2008 to 2014 of Cabo Verde. No data until 2007. Number of actual observations by date: 7.
Source name:
World Development Indicators
Source organization:
Development Assistance Committee of the Organisation for Economic Co-operation and Development, Geographical Distribution of Financial Flows to Developing Countries, Development Co-operation Report, and International Development Statistics database. Data are available online at: www.oecd.org/dac/stats/idsonline. World Bank gross capital formation estimates are used for the denominator.
Categories, topics:
Aid Effectiveness
Last updated:
apr 23, 2017
Indicators value changes by year
Meaning:
31.818
Minimum:
21.912
jan 1, 2008
Maximum:
41.799
jan 1, 2014
At the date of observation
Value
Absolute change
Change from the previous value
jan 1, 2008
21.912
+21.912
0.0%
jan 1, 2009
25.537
+3.625
16.54%
jan 1, 2010
26.094
+0.557
2.18%
jan 1, 2011
41.299
+15.205
58.27%
jan 1, 2012
28.401
-12.898
-31.23%
jan 1, 2013
37.683
+9.282
32.68%
jan 1, 2014
41.799
+4.115
10.92%
Ranking of countries by current statistics by years