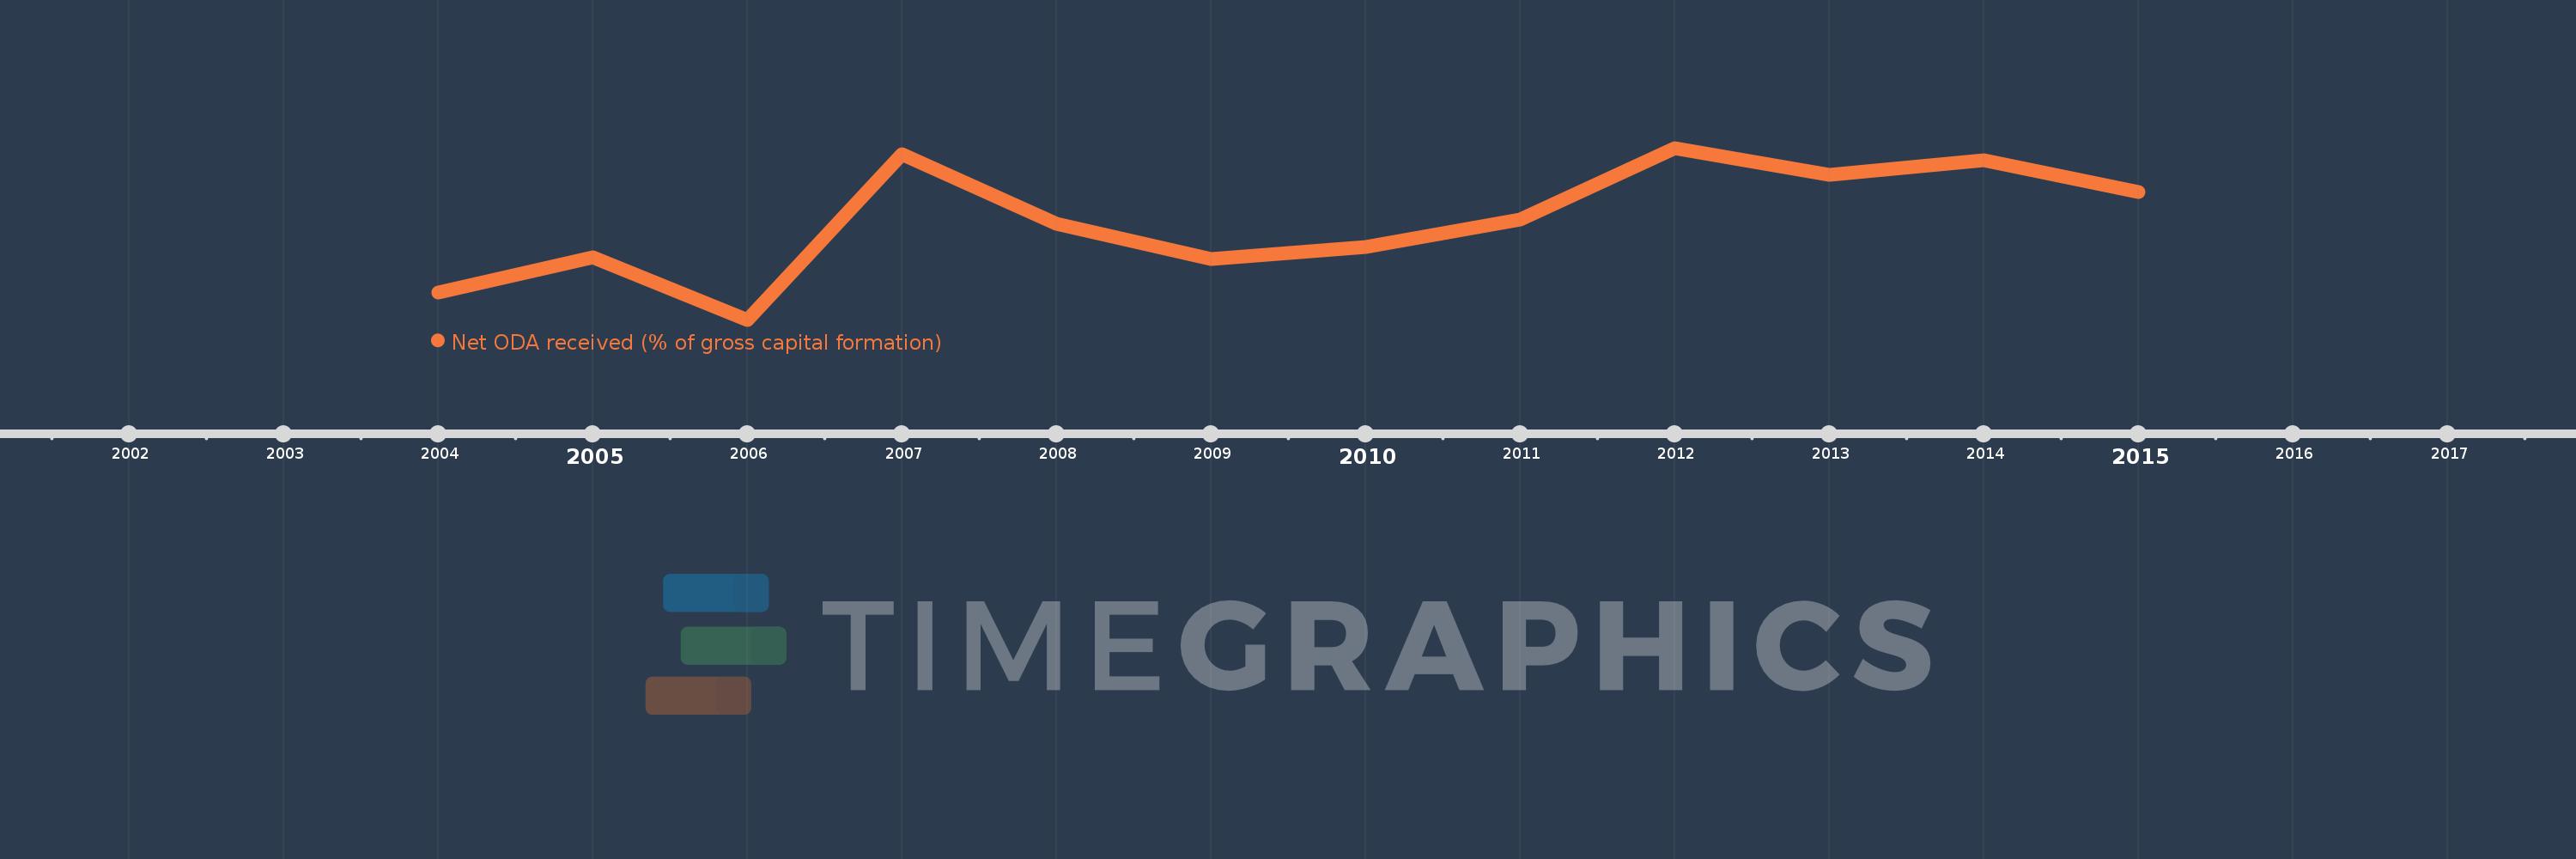
This timeline shows a graph from 2004 to 2015 of Montenegro. No data until 2003. Number of actual observations by date: 12.
Source name:
World Development Indicators
Source organization:
Development Assistance Committee of the Organisation for Economic Co-operation and Development, Geographical Distribution of Financial Flows to Developing Countries, Development Co-operation Report, and International Development Statistics database. Data are available online at: www.oecd.org/dac/stats/idsonline. World Bank gross capital formation estimates are used for the denominator.
Categories, topics:
Aid Effectiveness
Last updated:
apr 23, 2017
Indicators value changes by year
Meaning:
8.733
Minimum:
0.965
jan 1, 2006
Maximum:
14.436
jan 1, 2012
At the date of observation
Value
Absolute change
Change from the previous value
jan 1, 2004
3.092
+3.092
0.0%
jan 1, 2005
5.838
+2.746
88.79%
jan 1, 2006
0.965
-4.873
-83.48%
jan 1, 2007
13.934
+12.97
1.34K%
jan 1, 2008
8.519
-5.416
-38.87%
jan 1, 2009
5.704
-2.815
-33.04%
jan 1, 2010
6.68
+0.976
17.12%
jan 1, 2011
8.832
+2.152
32.21%
jan 1, 2012
14.436
+5.604
63.46%
jan 1, 2013
12.328
-2.108
-14.6%
jan 1, 2014
13.478
+1.15
9.33%
jan 1, 2015
10.984
-2.494
-18.51%
Ranking of countries by current statistics by years